Hello, aspiring ethical hackers. In one of our previous blogposts, you learnt in detail what is packet sniffing, types of sniffing, what are sniffers and types of sniffers? In this article, you will learn about Wireshark, the most popular sniffer used in cybersecurity.
What is Wireshark?
Wireshark is an open-source network packet analyzer that is used for network trouble shooting, network analysis etc. It runs on Linux, macOS, BSD, Solaris and even on Windows. It is installed by default in pen testing distros like Kali Linux and we are going to use the same for this tutorial. On Kali Linux, Wireshark sniffer can be started using the command “wireshark” in the terminal as shown below.
This will open the Wireshark GUI window as shown below.
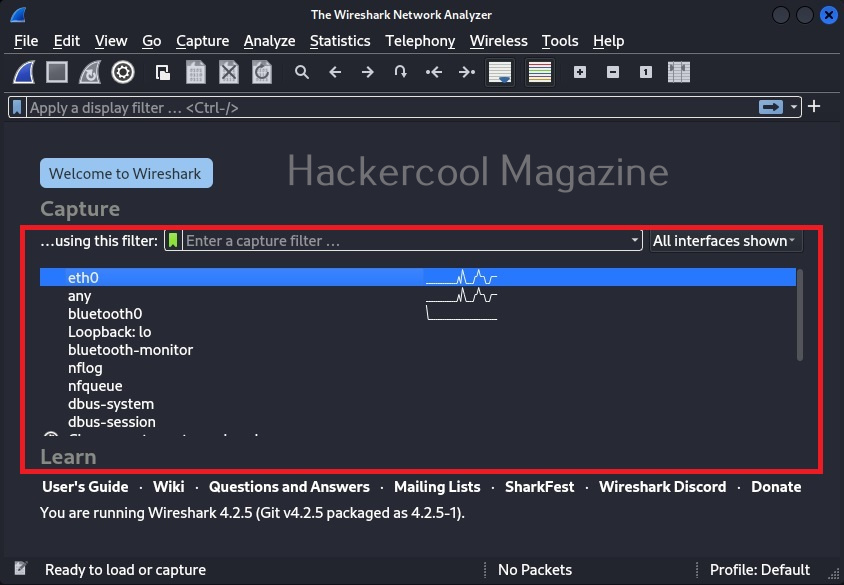
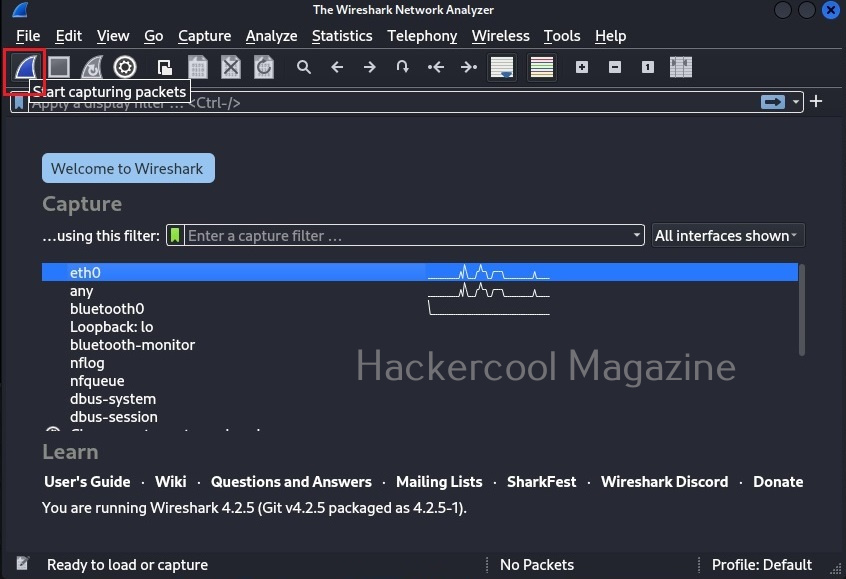
In the newly opened Wireshark windows, all the network adapters attached to the system (in our case, virtual machine) on which Wireshark is running has are displayed. Select the network interface on which you want to capture packets (ours is eth0) and click on “Start capturing packets”.
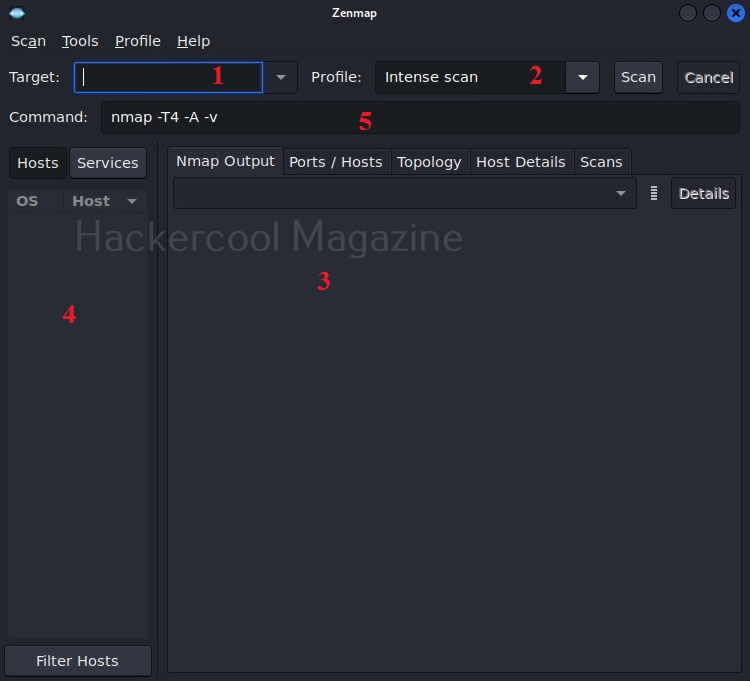
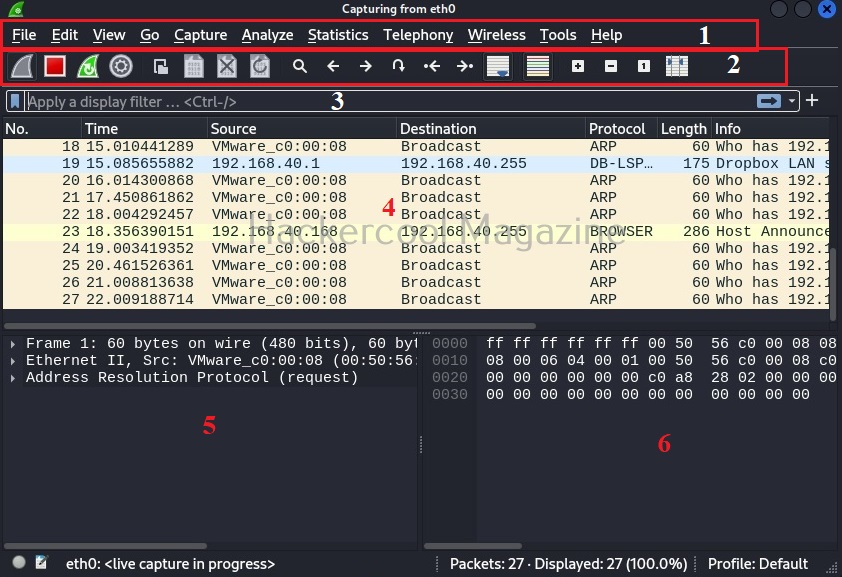
Wireshark will start capturing live packets of the network. Here, it is time to learn about the interface of Wireshark. The interface of Wireshark can be divided into 5 primary parts. They are,
1. Menu bar: Common to all GUI applications and doesn’t need explanation.
2. The Main toolbar: The main toolbar consists of items for the operation of Wireshark. For example, like starting capture, stopping capture, restarting capture, saving capture to a file etc.
3. The Filter toolbar: The Filter toolbar is used to apply display filters for the captured packets. More about it later.
4. The “Packet List” name: This pane displays all the packets captured by Wireshark. These are separated by each line. By default, the “packet list” name consist of seven columns. They are,
- Number: The number of the packet in the capture file.
- Time: Time of capture of the packet.
- Source: The source from where the packet originated.
- Destination: The destination address where the packet went.
- Protocol: The protocol information about the captured packet: ex: ARP, ICMP etc.
- Length: Length of the captured packet.
- Information: Additional information about the packet.
5. The “Packet details’ pane: This pane shows the current packet in a more detailed form.
6. The “Packet Bytes” pane: This name shows all the details of the selected packet in style.
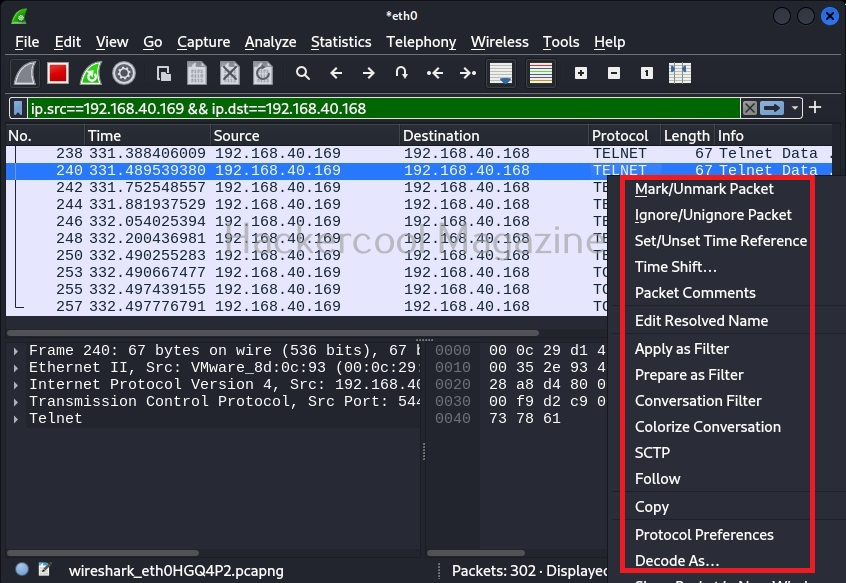
By now, you are accustomed to the interface of Wireshark. Let’s move forward. In the “packet list” pane, you can see all the packets. You can select each packet to see information about it. You can right click on each packet, to open a new menu too. For example, you can follow TCP stream of each packets. Well, there is a packet belonging to Telnet protocol going from 192.168.40.169 IP to 192.168.40.162. Following its TCP stream can be interesting. But you will learn about this in password sniffing.
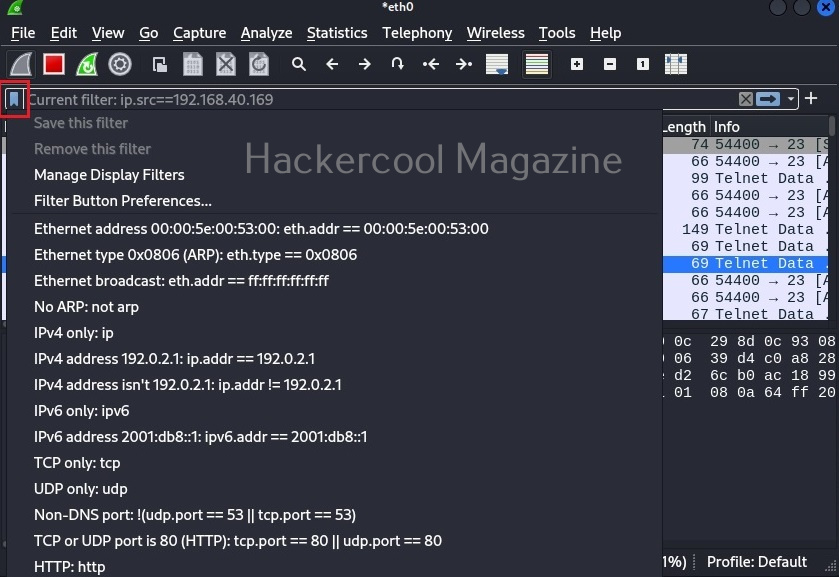
The important concept beginners should learn about Wireshark is the Wireshark filters. If you see the Wireshark packet capture, it will be overwhelming if not confusing. Wireshark filters allow us to bring some clarity to the captured traffic. Filters can be applied to Wireshark from the “Filter” toolbar. Wireshark has some mostly used filters which can be viewed as shown below.
Let’s learn about some common filters useful to beginners. In the filter column, add this filter.
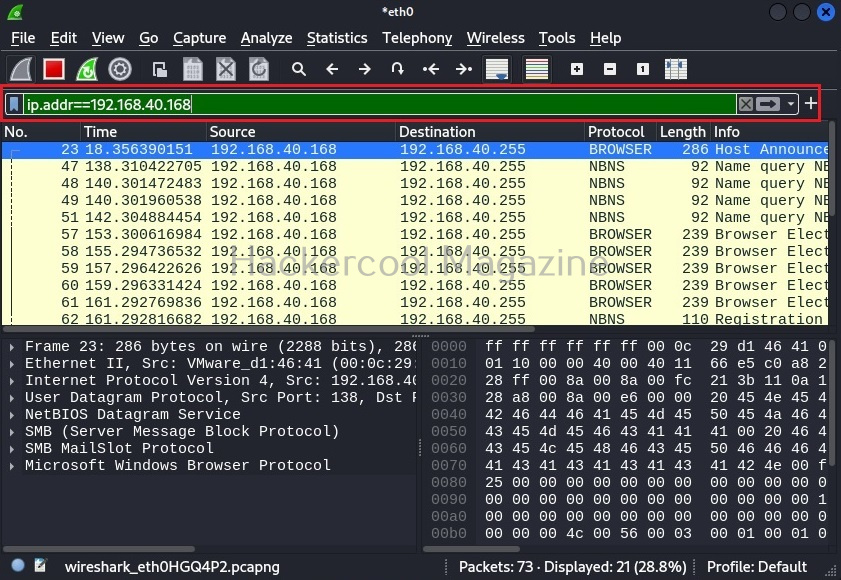
ip.addr==192.168.40.168
ip.addr==192.168.40.168
The default syntax of Wireshark filter is “ip.addr = = value”. For example, if you want to view the traffic of a particular IP address, this filter is used. Let’s say we want to view traffic of only the system whose IP address is “192.168.40.168”.
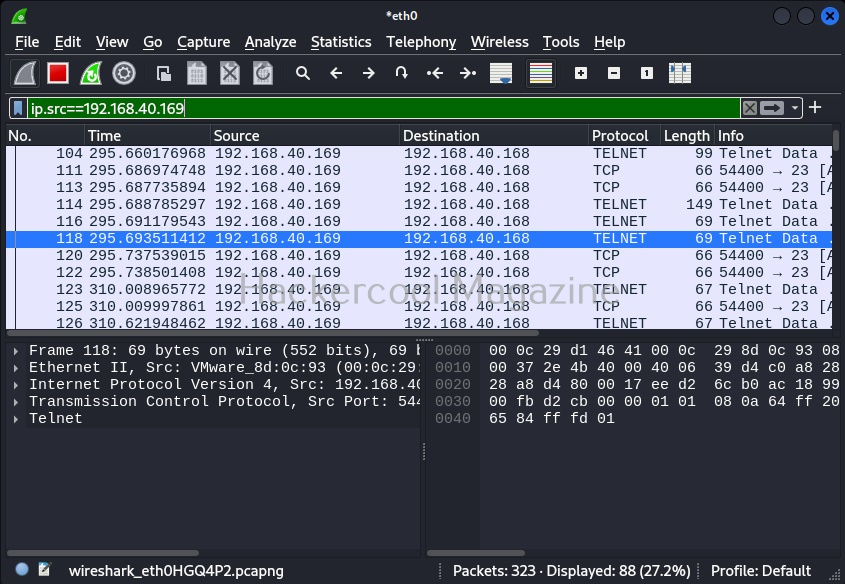
Let’s make it better. You want to view all the traffic originating from IP address 192.168.40.168 then the below filter will help.
ip.src == 192.168.40.169
Similarly, we can use “ip.dst = = 192.168.40.169” filter to see all the packets coming to machine with IP address 192.168.40.169. We can also combine two filters using ampersand (&&). For example, you want to view the packets originating from IP 192.168.49.169 and coming to IP 192.168.40. 168.using the filter below.
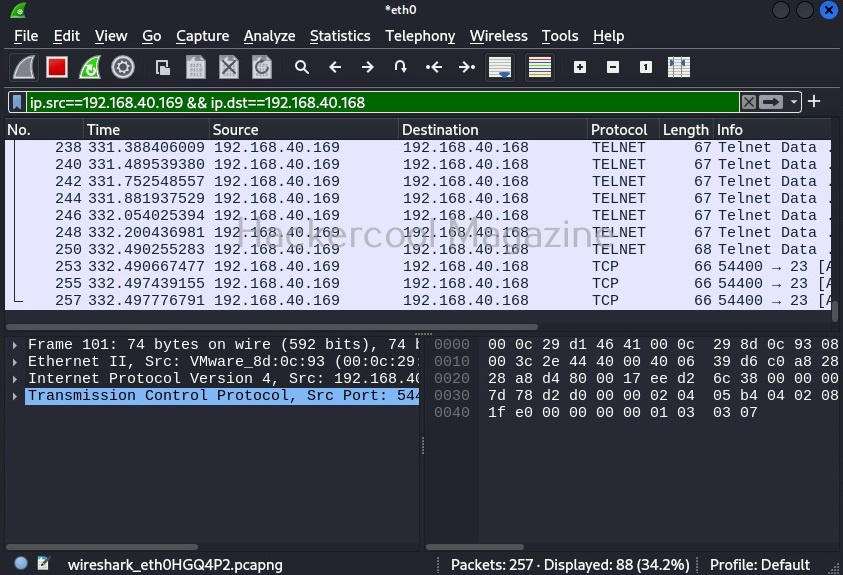
ip.src==192.168.40.169 && ip.dst==192.168.40.168
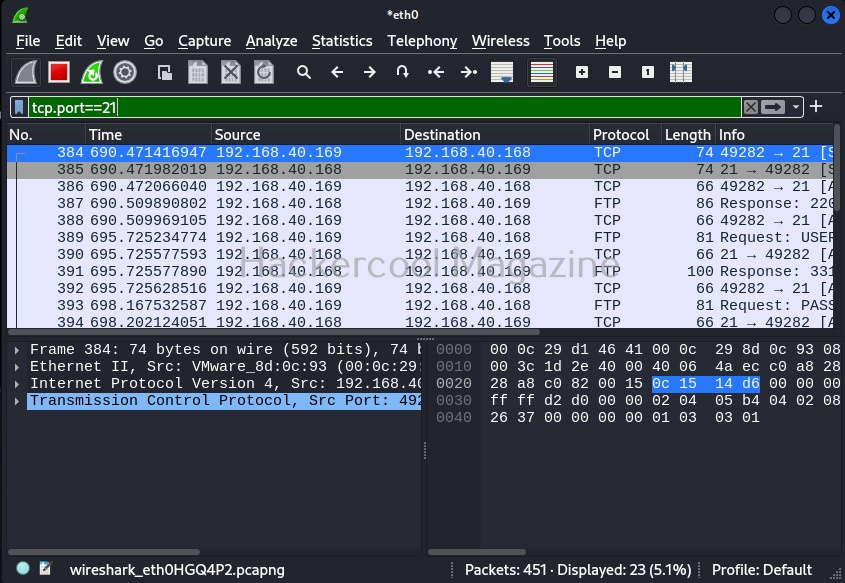
You can view even traffic belonging to a specific port in the entire network. For example, let’s view the traffic belonging to TCP port 21. “tcp.port == 21“ using filter as shown below.
tcp.port==21
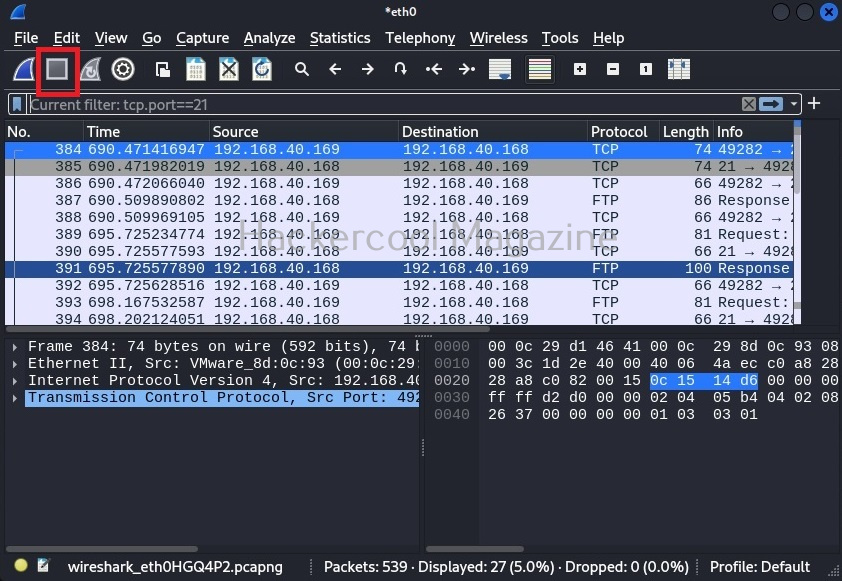
Those are some helpful filters for beginners. At any time, you can stop the capture from the “stop capture” option of Wireshark as shown below.
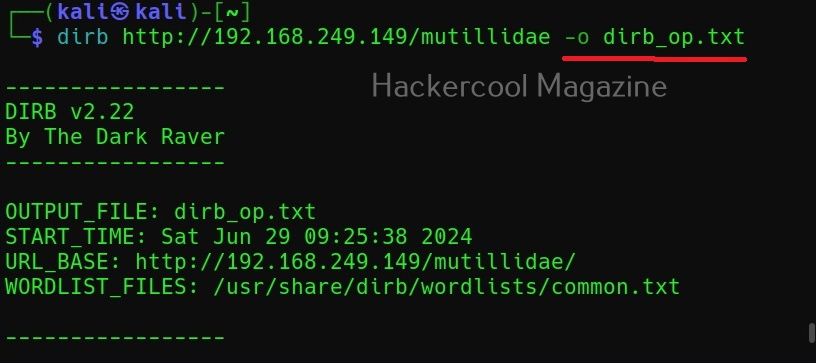
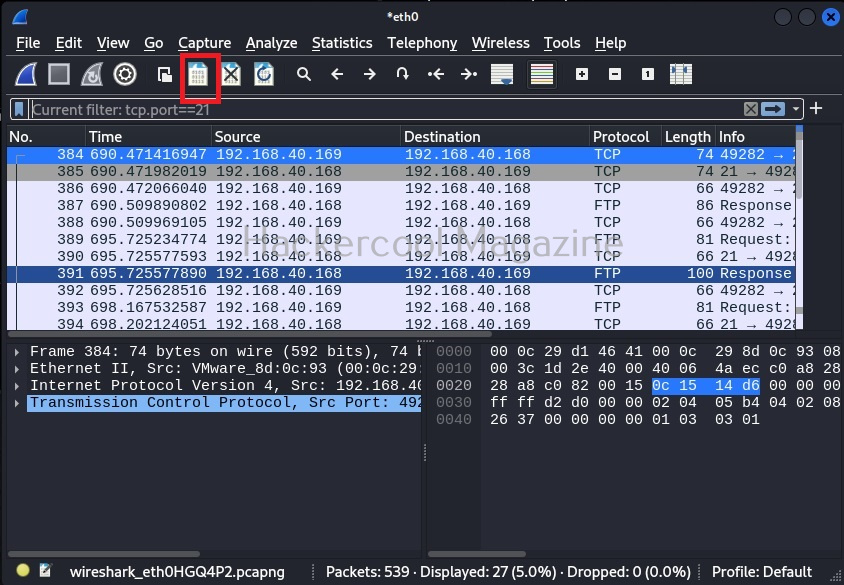
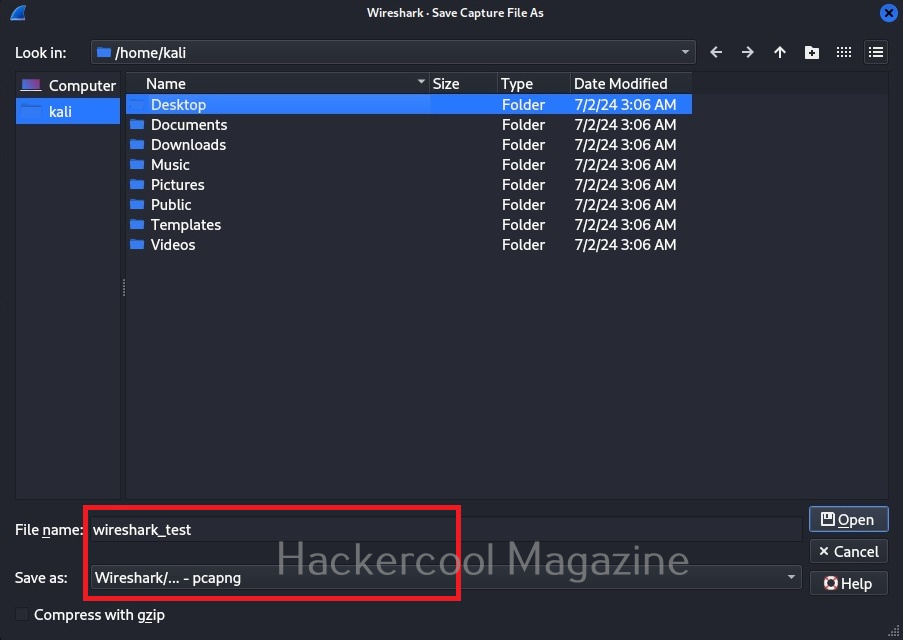
You can also save the captured packets in a file. By default, Wireshark saves the captured data in the pcap format.
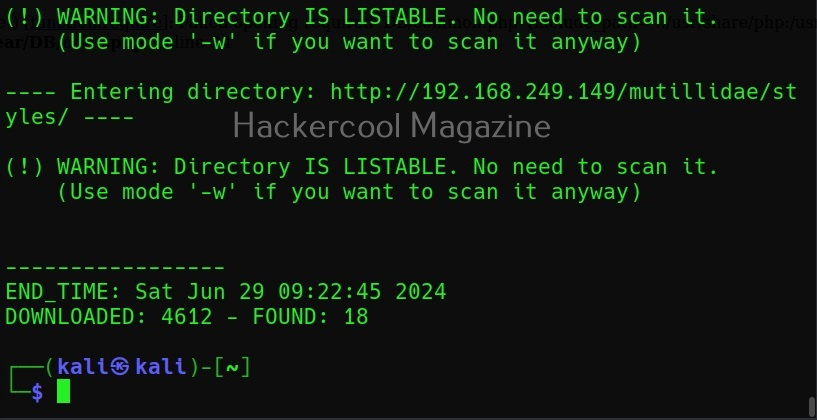
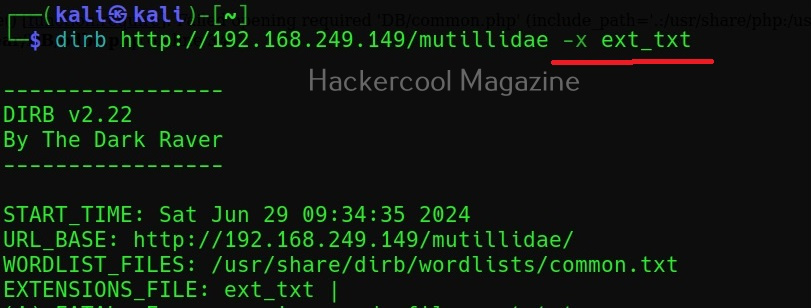
Ignore the warnings (-w)
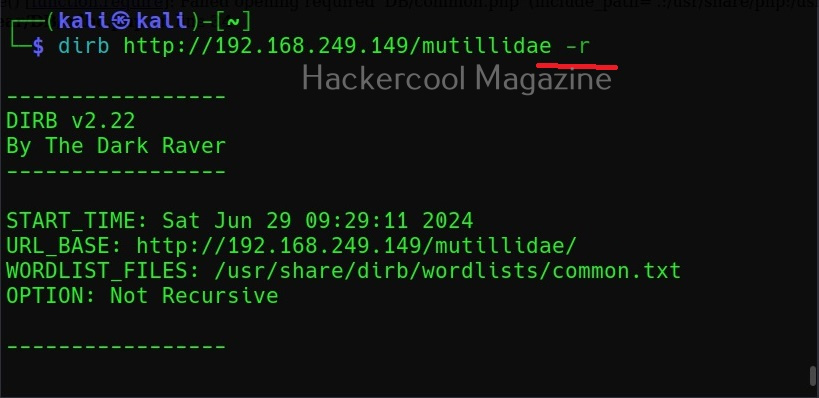
By default, while scanning, it avoids going into any directories that are listable. This makes common sense too. It displays the message saying “directories are testable”. If you want it to scan inside such directories, you can use this option (-w).
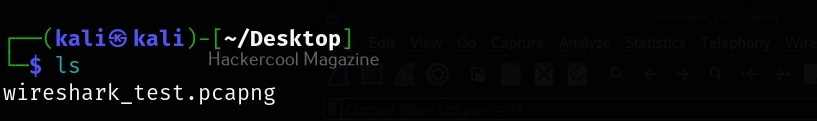
We can once again open this pcap file using Wireshark again for analysis later. Learn how to use ettercap.