
Hello, aspiring ethical hackers. In our previous blogpost, you learnt about reverse engineering. In this article, you will learn about OllyDbg, a debugger that is used to reverse engineer programs.
OllyDbg is an X86 debugger that is used to perform binary code analysis even when source code is not available. It can trace registers, switches, tables, constants, strings, recognize procedures, API calls and can even locate routines, object files and libraries. At present, this debugger can only disassemble binaries compiled for 32 bit processors.
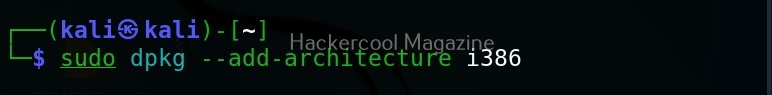
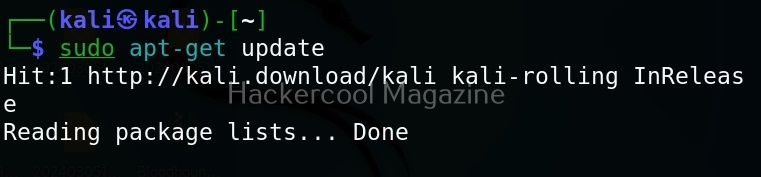
Let’s see how this tool works. For this, I will be using Kali Linux as OllyDbg is available in its repositories.
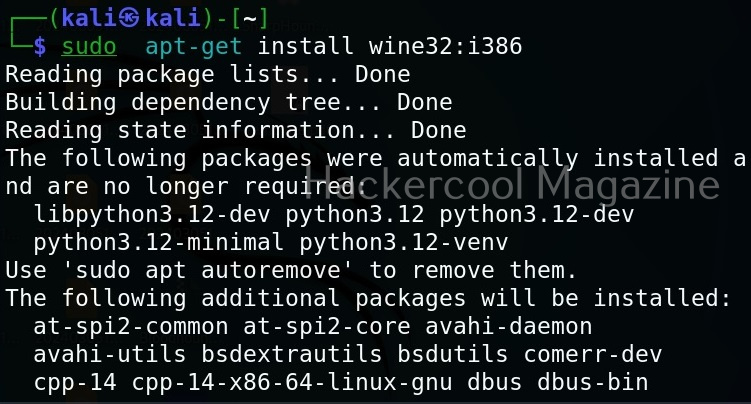
Note that OllyDbg can only run on Windows systems. To run it on Kali, you need to install wine.
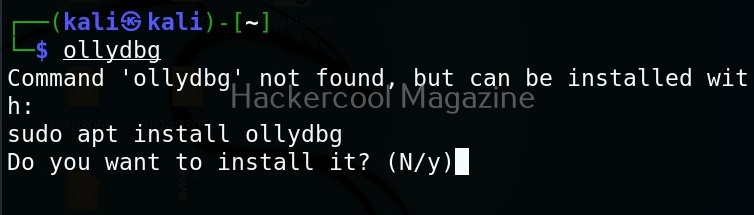
After wine is successfully installed, you can start Ollydbg using command shown below.
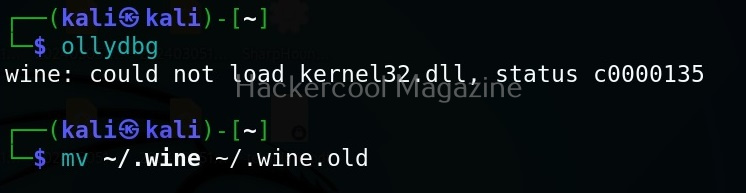
ollydbg
If it shows up wine error like this, just use the command shown below to fix it.
mv ~/.wine ~/.wine.old
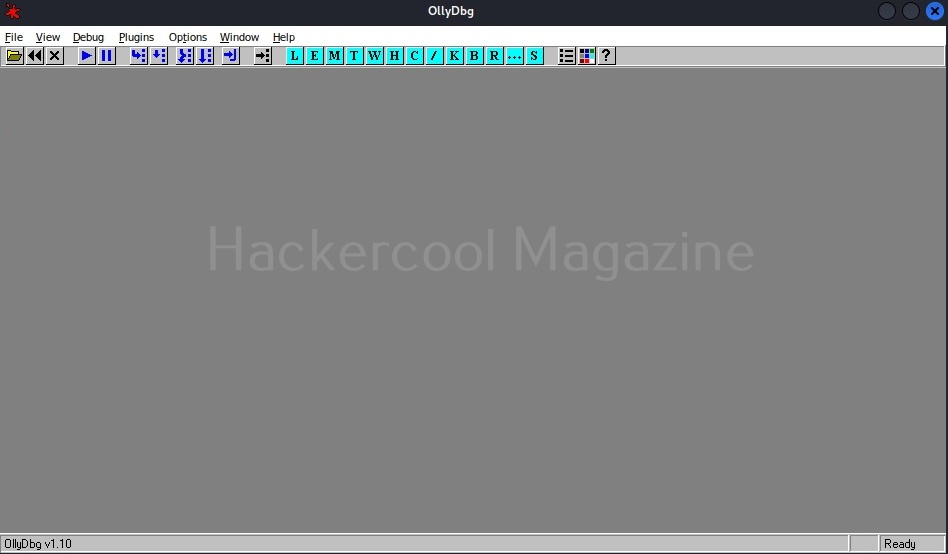
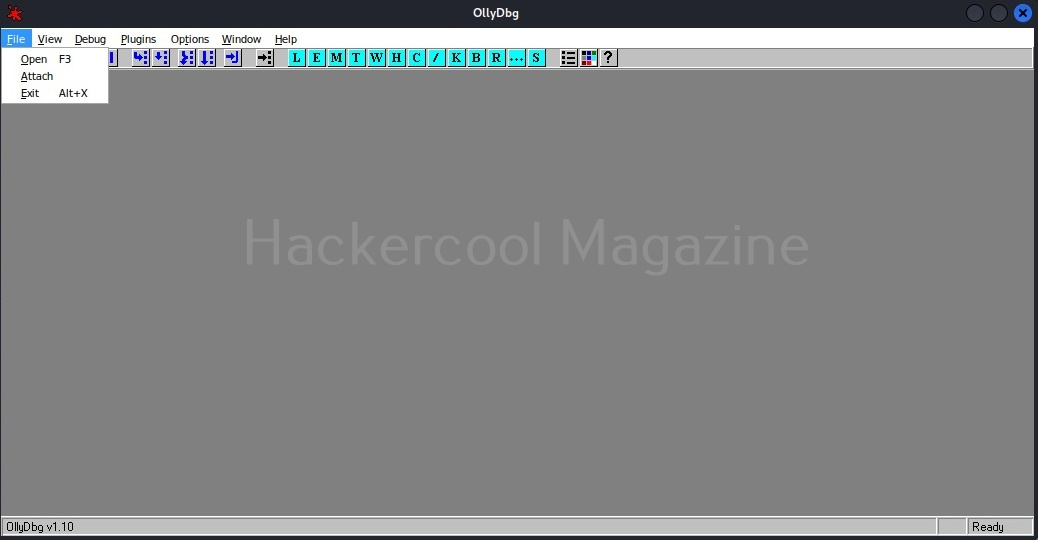
Now, OllyDbg should start normally. The interface looks as shown below.
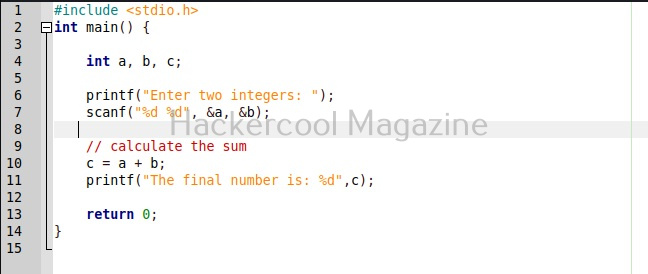
To see the working of Ollydbg, we need an executable file to disassemble. To help you understand how OllyDbg works in detail, I have written a simple program in C. The program is nothing new. It just adds two numbers provided by the users and displays the result. I name it “hc_app.c”.
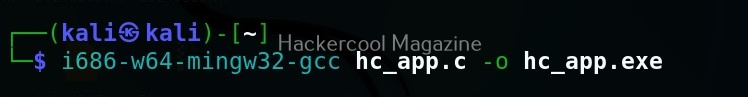
Then I compile it as shown below to get an exe file named “hc_app.exe”.
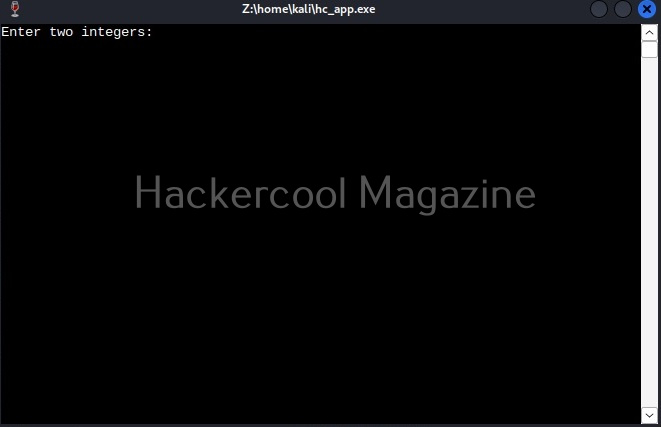
Let’s first check if the program works as expected.

The program “hc_app.exe” is working as expected. Now, let’s load this into OllyDbg. This can be done by dragging hc_app.exe to OllyDbg or by going to File menu>Open (F3) as shown below.
This will open file explorer.
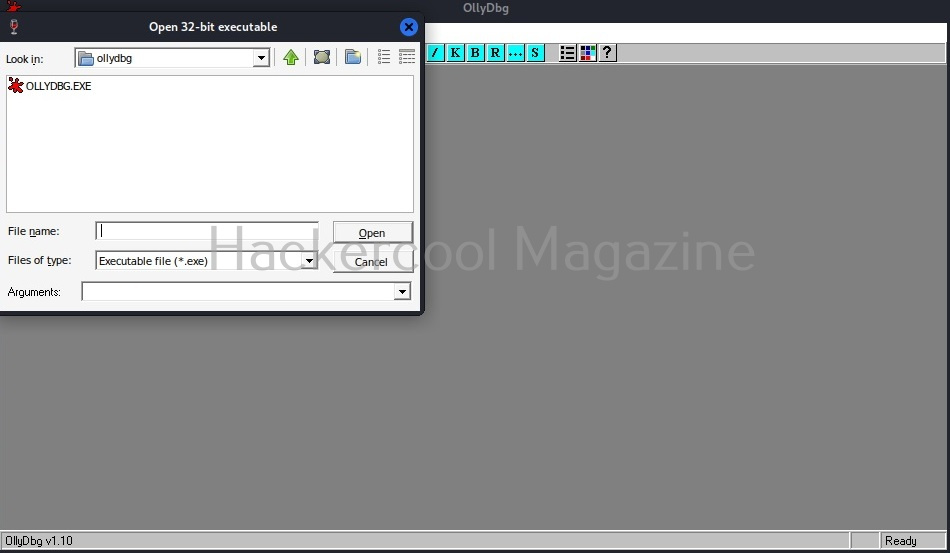
Navigate to the location of the app we just created and select it.
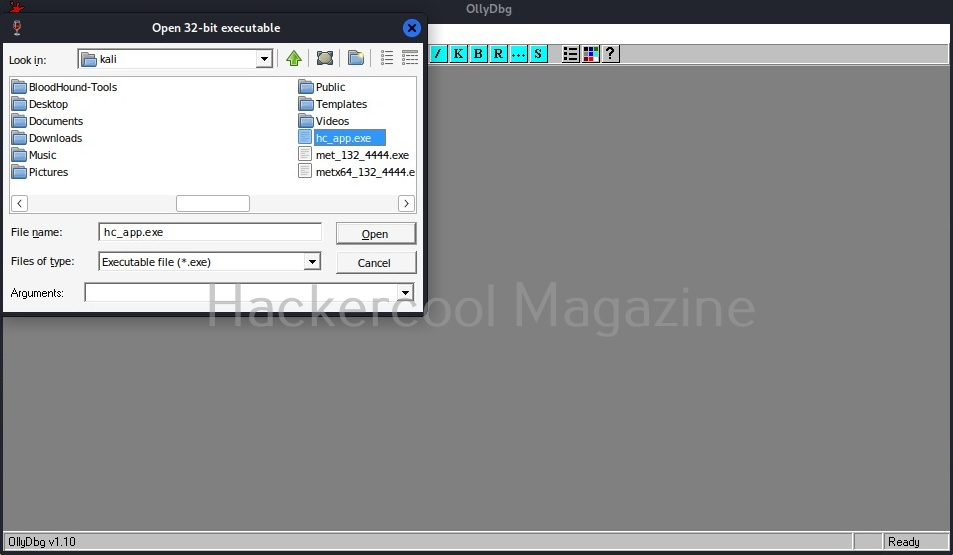
Doing this will open a terminal as shown below.
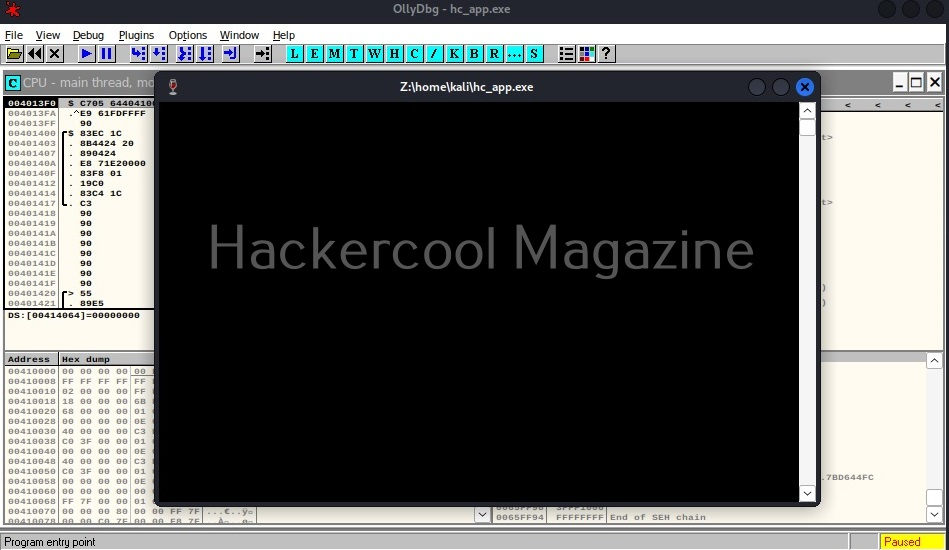
Minimize the terminal window for now. After minimizing it, you will see this on OllyDbg.
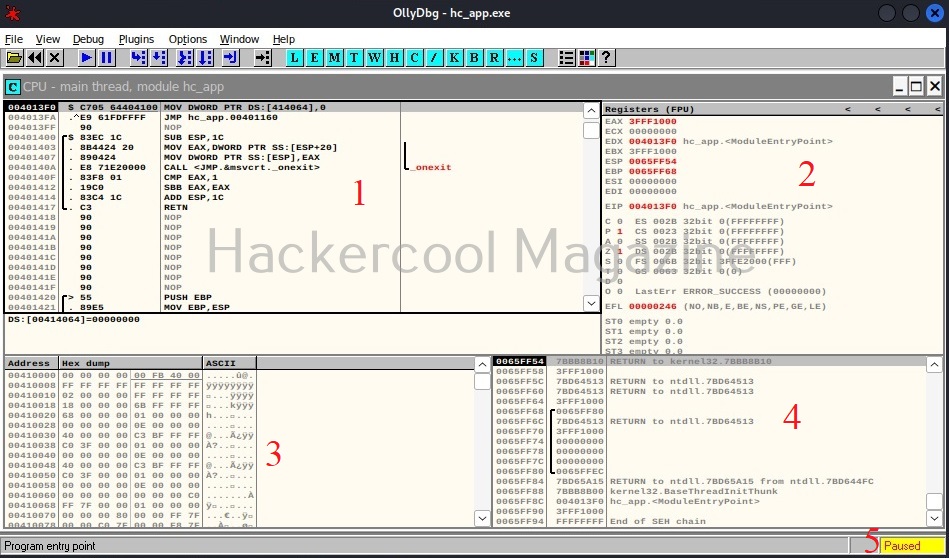
If you are a normal human like me, you will not understand anything. This is assembly code. The interface of OllyDbg is divided into 4 sections.
The first section is CPU window. This contains all virtual addresses of instructions. This window is located to the upper left of OllyDbg.
The second section is located to the upper right of the program and contains CPU registers.
The third section is located to the lower left. This has data residing in memory.
The fourth section, located to the bottom right is the stack.
Apart from this, I have assigned number ‘5’ in yellow. It shows if the program we loaded (hc_app.exe) is paused or running. Before doing anything, go to the Debug menu and hit “Run”. Now, bring forward the the command window we minimized earlier. It will change to this.
That’s all good. Now, let’s make something sense out of what looks like gibberish. Right click inside the CPU window, a menu should open. Select “Search for” and in the sub menu “All referenced text strings” as shown below.
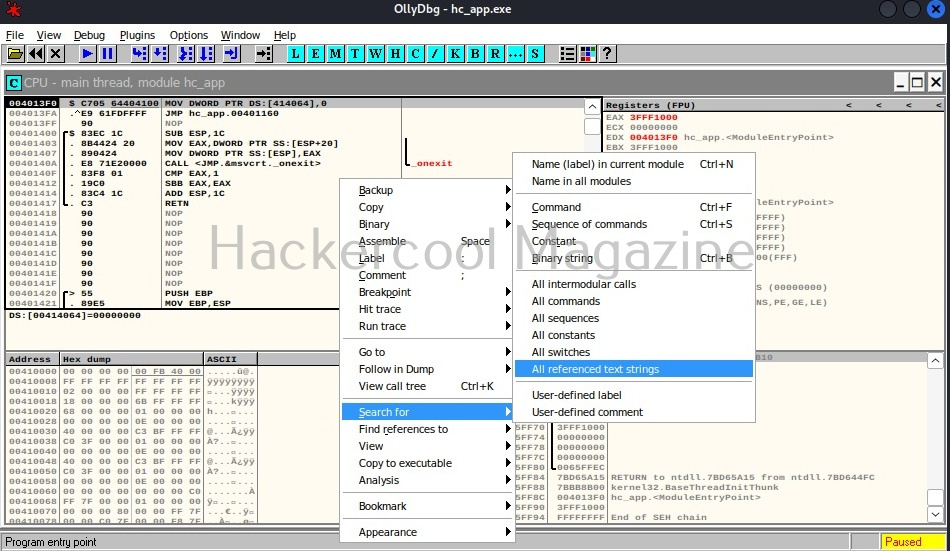
What we are doing is searching for all text strings referred to in the program. This will give output as shown below.
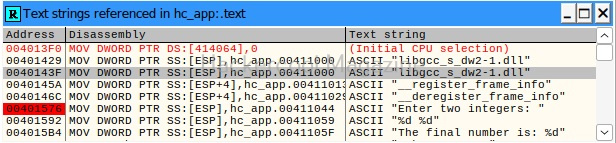
Here, you can see “Enter two integers:” and “The final number is :”. You remember something from the source code of the program. But note here that, we don’t have access to source code and only loaded the compiled program (hc_app.exe). To the left, highlighted in red, you can see the address at which this string is present. The address is “00401576”. Go to that address in CPU window.
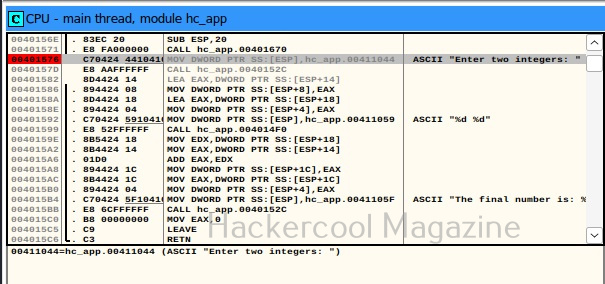
See the disassembled code here. It is this.
MOV DWORD PTR SS: [ESP], hc_app.00411044
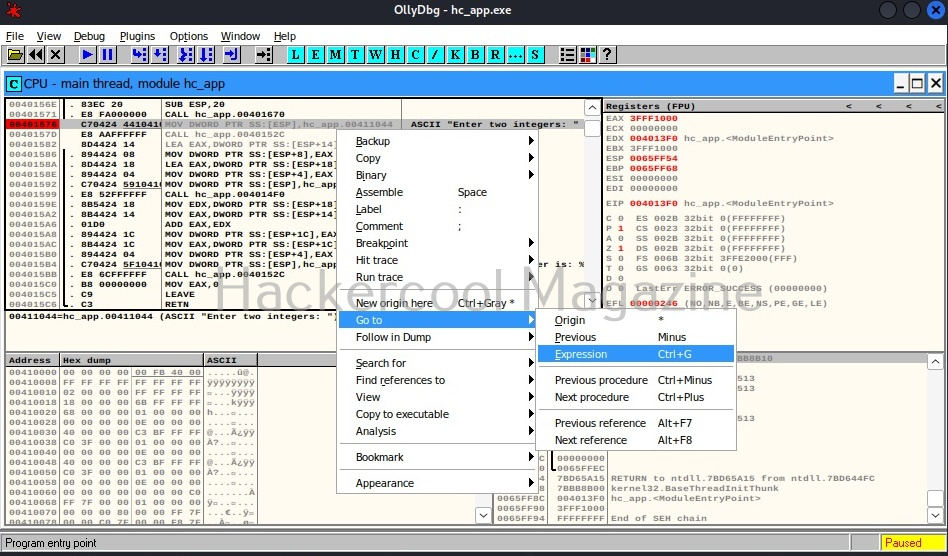
The important thing here is the address “00411044”. Pointers in C point to a memory address. So, this command is pointing to a memory address “00411044”. Once again right click in CPU window select “Go to” this time and select “Expression” (shortcut for this is CTRL+G).
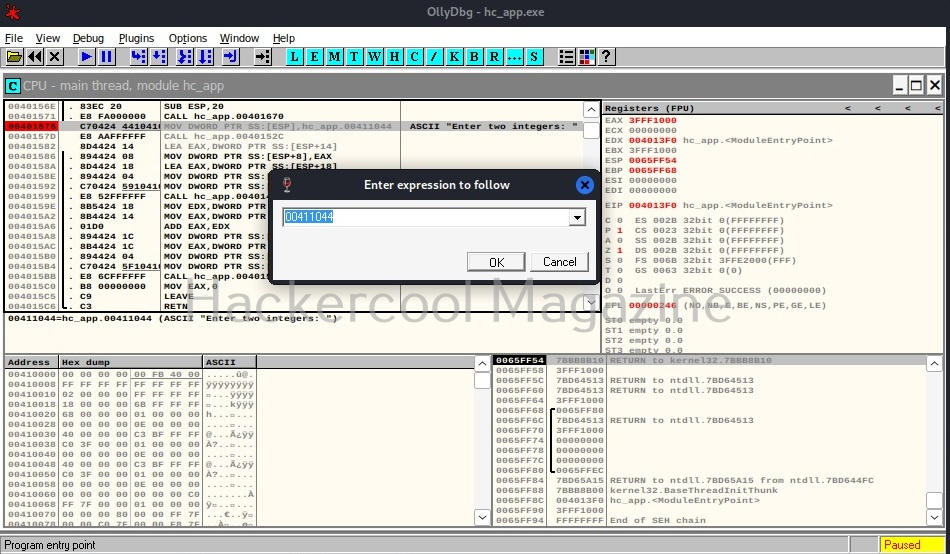
In the window that opens, enter address value as shown below and click on “OK”.
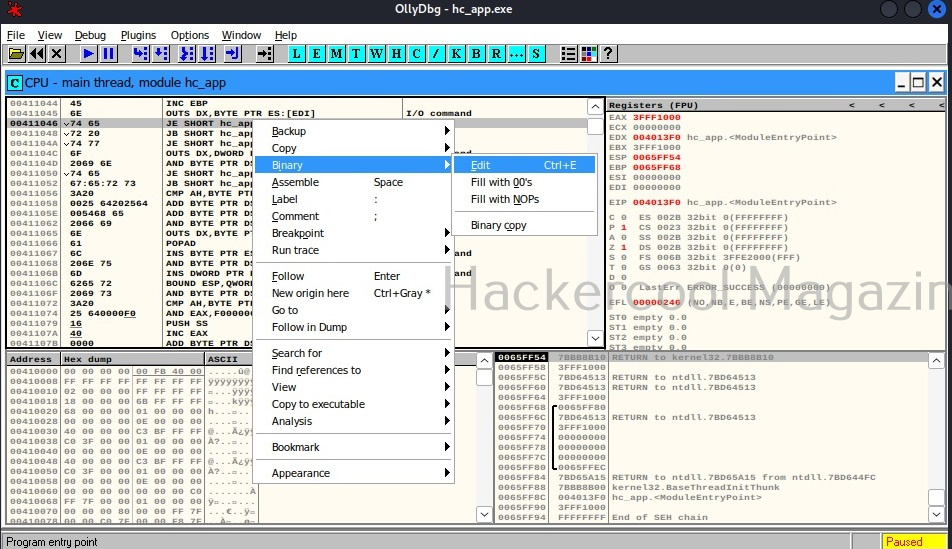
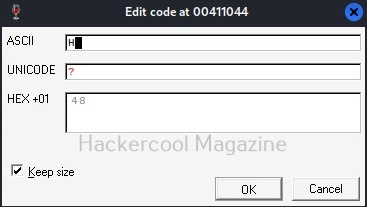
You should see this in CPU window. At address “00411044”, you should see a command “INC EBP”. Right click on that command and go to Binary>Edit as shown below.
A new window opens as shown below.
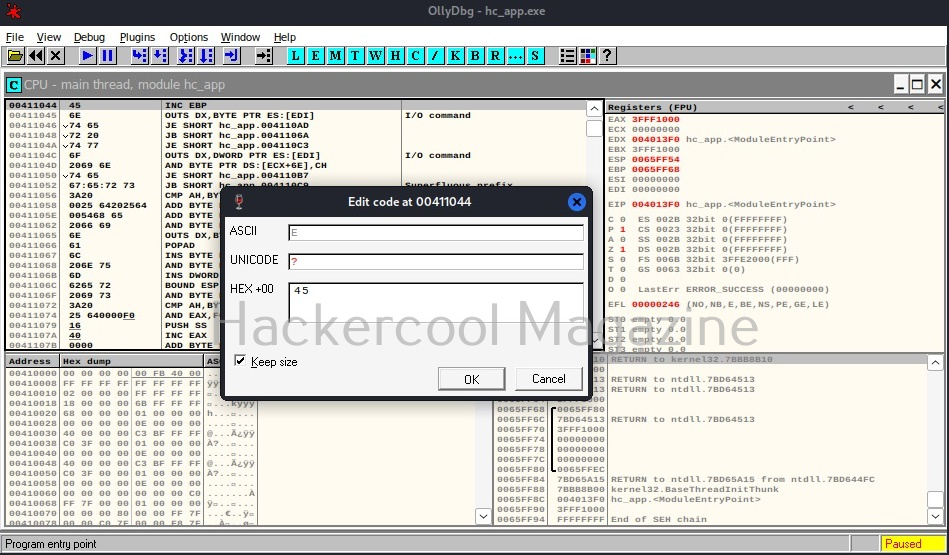
Observe the ASCII value. It is ‘E’. Similarly do it for next four commands.
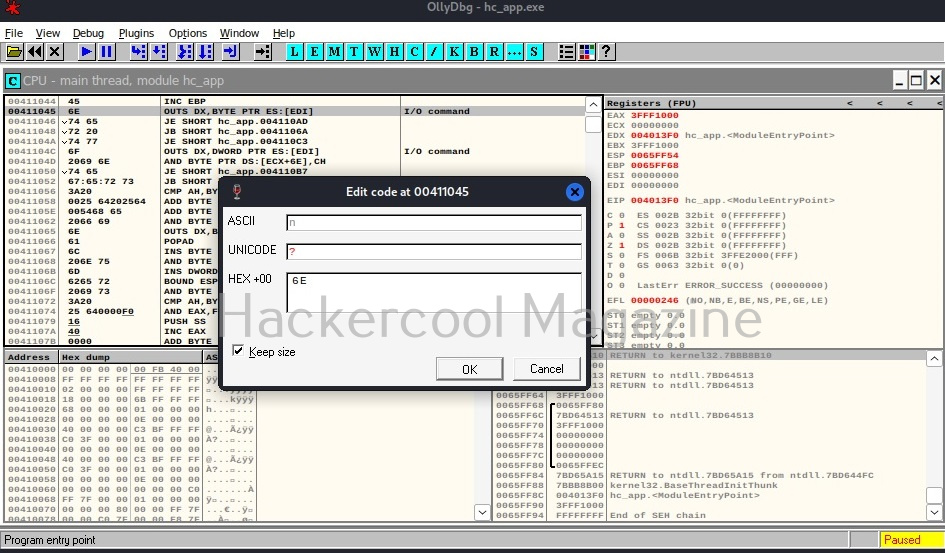
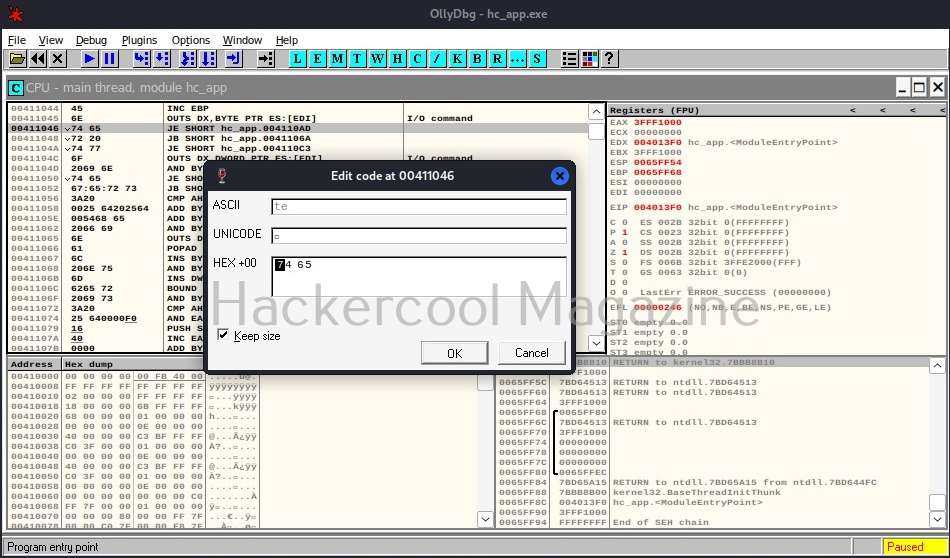
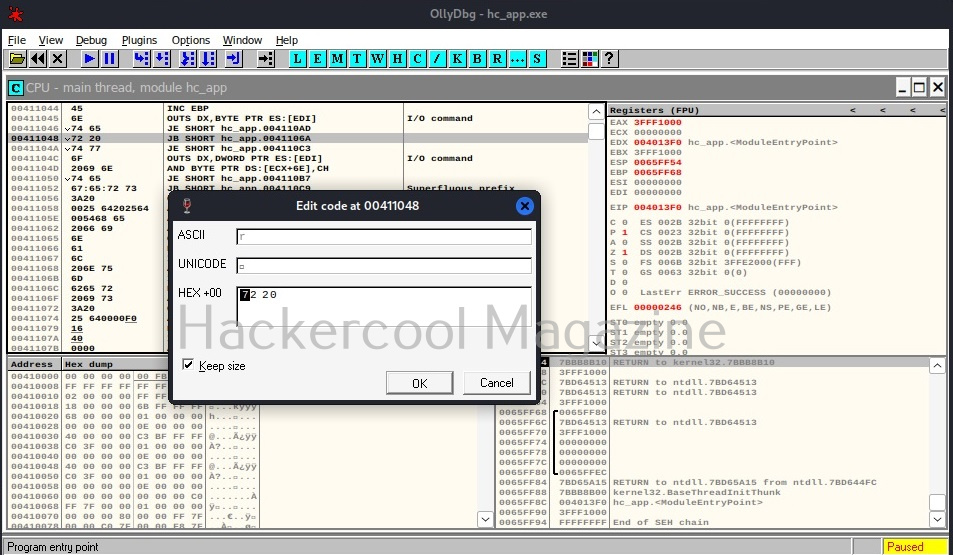
Here are the combined ASCII values. They are ‘E’ ‘n’ ‘te’ ‘r’. What does it become? “Enter”.. I think you have figured out where this is going. This is part of the text, “Enter two integers:”. Right.
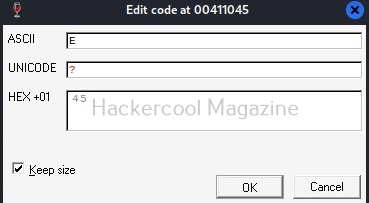
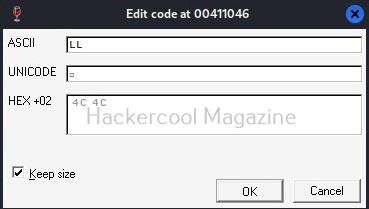
Now let’s do one thing. Change the ASCII value of ‘E’ ‘n’ ‘te’ ‘r’ to ‘H’ ‘E’ ‘LL’, ‘O’. respectively as shown below.
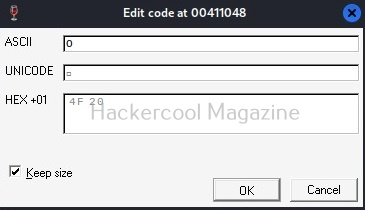
Now, when we go to debug menu and run the code again, instead of “Enter Two integers” we got “HELLO two integers” as shown below.
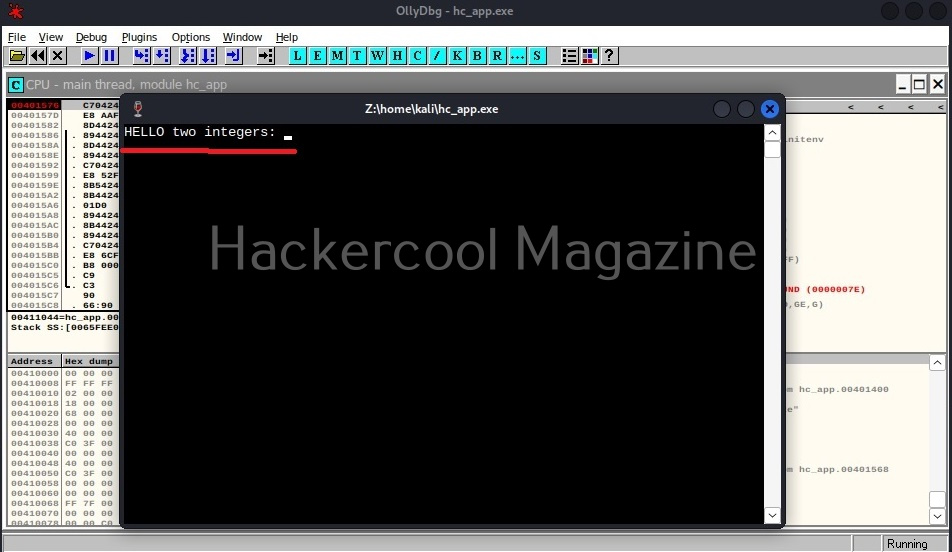
Here, you can see that we have successfully altered the code of a program without even knowing its source code. Next, learn how to perform static analysis of a program or malware with PEframe.
Follow Us