Hello, aspiring ethical hackers. In our previous blogpost, you learnt about Antivirus. In this article you will learn about Endpoint Detection and Response (EDR). Let’s begin with what is it.
What is Endpoint Detection and Response (EDR)?
Endpoint Detection and Response, also known as Endpoint detection and Threat response (EDT) is a tool used in endpoint security that can detect, contain, investigate and remediate malware, ransomware and other threats like cyber attacks on endpoint devices. This endpoint devices maybe desktop, laptop, mobile, servers and virtual machines.

Both are endpoint security solutions that protect the endpoint devices from malware and viruses. Although its functionality is similar to Antivirus, it is different from Antivirus. While Antivirus detects known malware & viruses, EDR can also detect advanced cyber threats and even actions that seem suspicious. It has a centralized management with agents installed on client devices with a centralized management on one device.
An EDR has two components. They are,
- Endpoint data collection agent.
- Endpoint centralized management console.
The endpoint agents are installed on the endpoint devices whose security needs to be monitored. This can include multiple devices. These agents collect data from the endpoint devices and send it to the centralized management console.
Importance of EDR
Constantly evolving threat landscape makes the role of EDR very important in cybersecurity. EDR’s not only mitigate known threats, but they also neutralize unknown threats based on their behaviors or action. Not just that, they mitigate the threat by responding with a counter action. EDR’s also play a role in automatic incident response and even in digital forensics and compliance testing.
How EDR works?
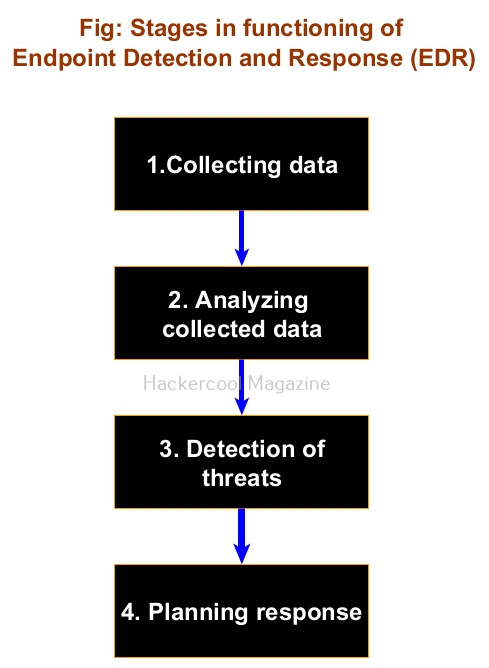
An EDR has the following stages while functioning. They are,
1. Collecting data:
This is the first stage and in this stage all the agents installed on endpoint devices collect data and send it to the management console. Analysts monitor the security of the devices from a single location.
2. Analyzing collected data:
All the data collected by endpoint agents may not be important from security point of view. So, the centralized Management console of an EDR filters the data and analyses it for any threats.
3. Detecting threats:
While analyzing the collected data, if EDR finds anything dangerous, it flags it as a threat and triggers an alert.
4. Planning response:
Not just sending an alert, it also responds to mitigate the threat on the machine it is detected.