Posted on

Beginners guide to Kismet

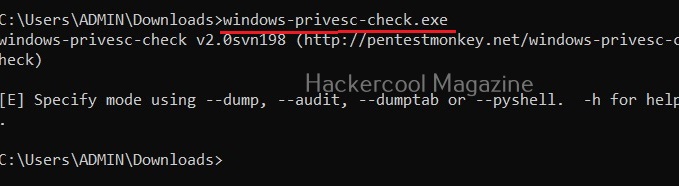
Hello, aspiring ethical hackers. In our previous blogpost, you learnt everything about wifi hacking. In this article, you will learn about kismet, a wifi security assessment tool.

Kismet is a wireless network and device detector, sniffer, war driving tool and intrusion detection system (WIDs) for not just wifi but also Bluetooth, Zigbee, RF and more. Let’s see the working of this tool. For this, I will be using Kali Linux as kismet is installed by default on Kali or is present in its repositories. We will also be needing a wireless adapter that can monitor wireless packets. I am using ALFA AWVS036NHA adapter for this article.

First thing we do is to plugin the adapter to the system and check if it is connected to the device using command shown below.

iwconfig

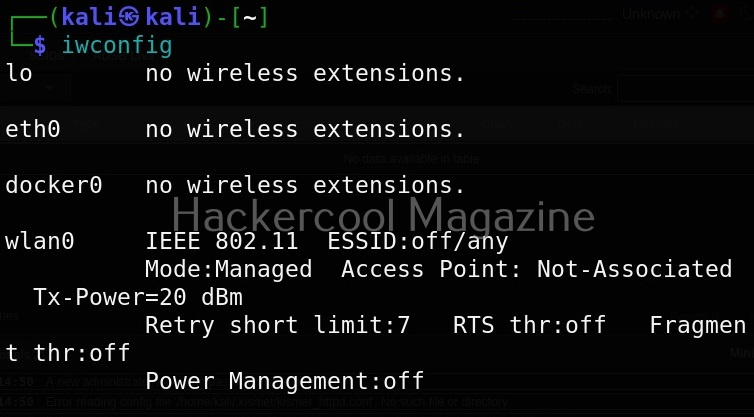
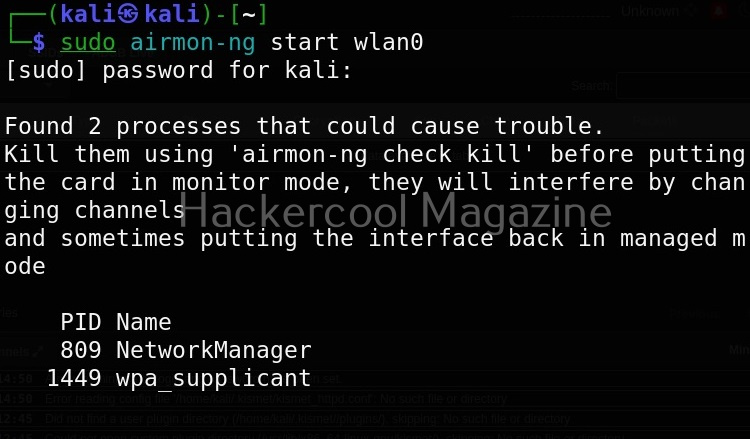
In the above image, you can see our wireless interface is named “wlan0”. Next, we start monitor mode on our wireless adapter using command as shown below. Monitor mode allows the adapter to scan for all wireless networks in the air.

sudo airmon-ng start wlan0

We can confirm if monitor mode is enabled on the adapter by once again using “iwconfig” command.

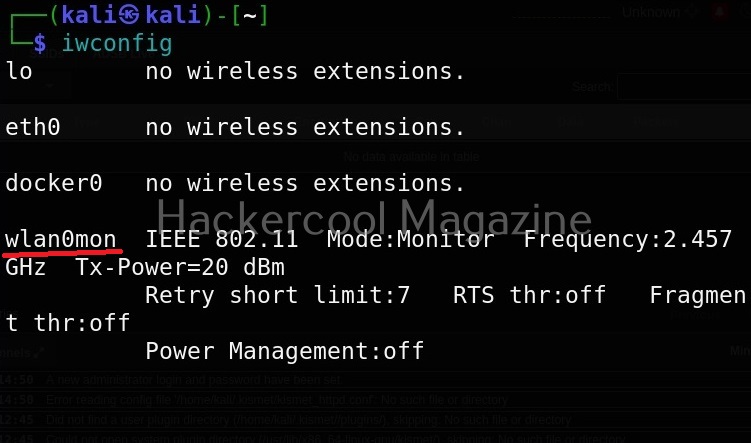
As you can see in the above image, the mode of the adapter changed from managed to monitor and its name changed to wlan0mon from wlan0. Now we have to start kismet on this interface. It can be done as shown below.

sudo kismet -c <wireless interface>

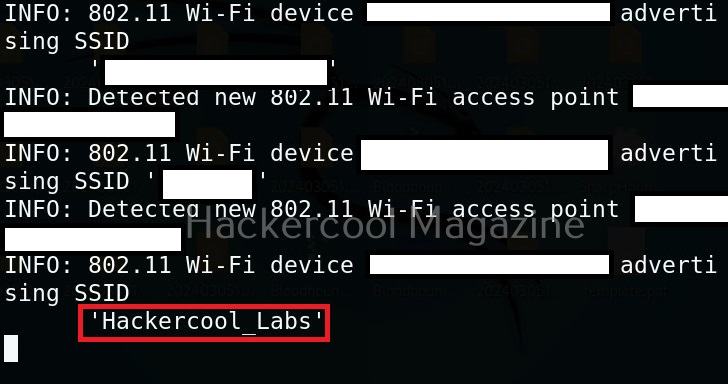
kismet starts capturing data immediately as shown below.

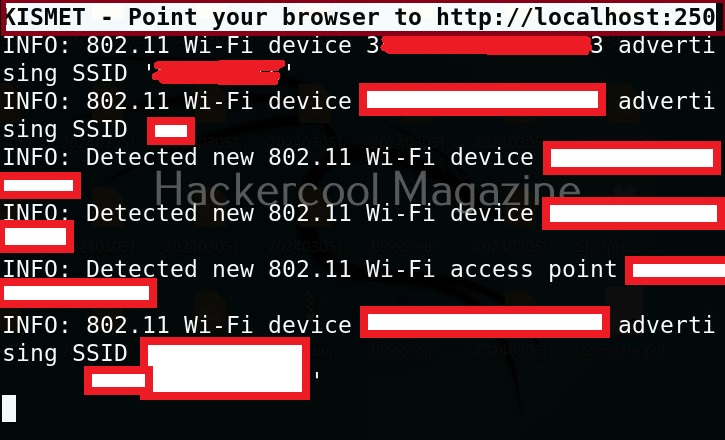
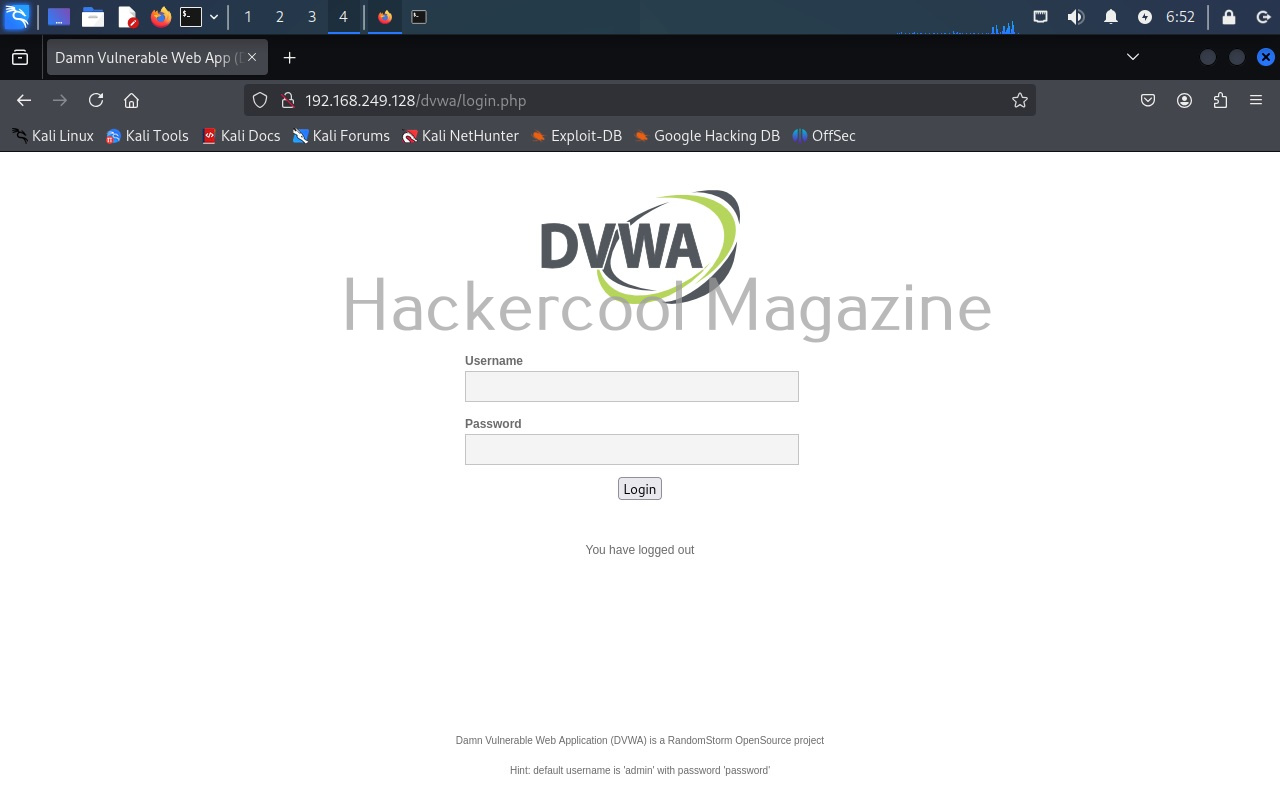
You can see the wireless network and wireless devices in a browser with the link given at the beginning of the capture. The URL is “localhost:2501”. Go to the URL using a browser. As soon as you do that, you will be faced with a login screen as shown below.

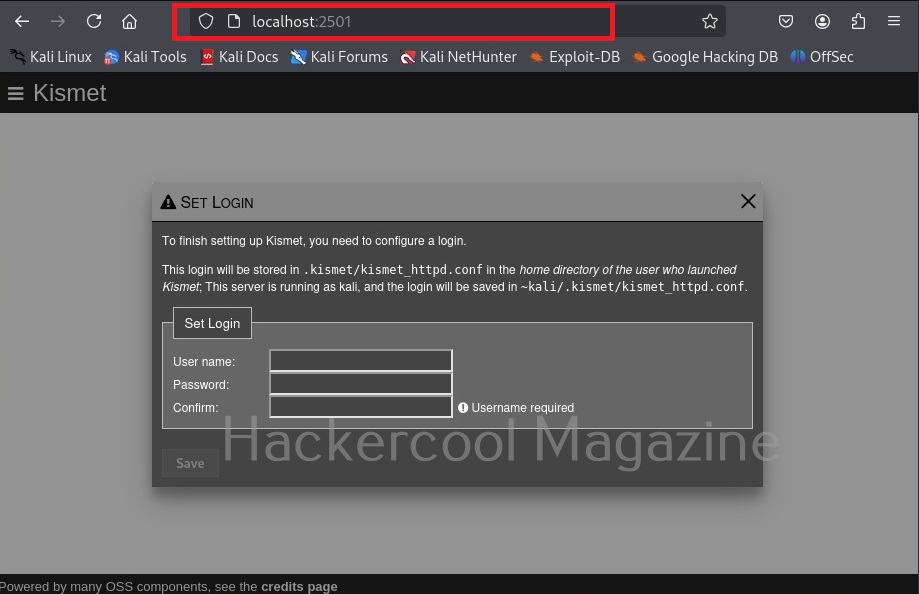
Since you are setting up kismet for the first time, set a username and password and most importantly don’t forget them.

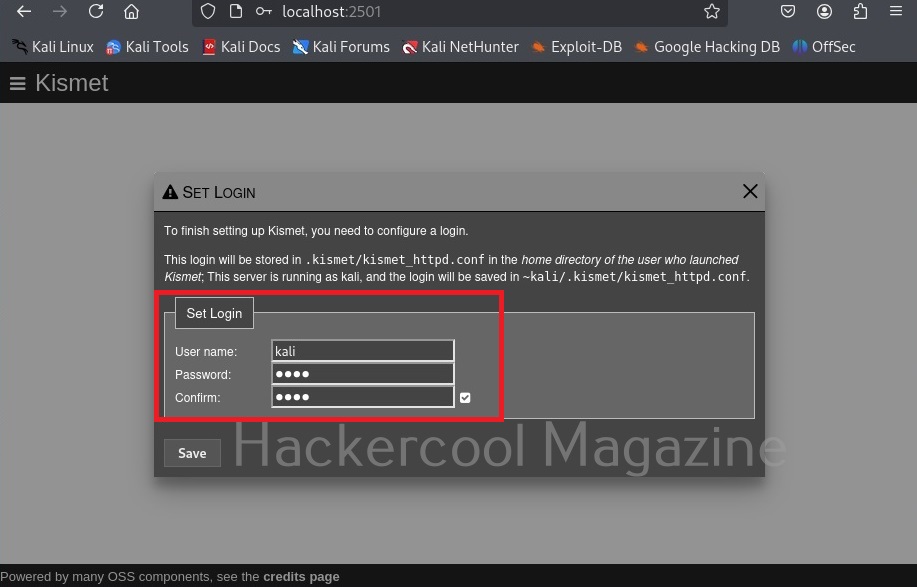
Then click on “Continue” to see the interface of kismet.

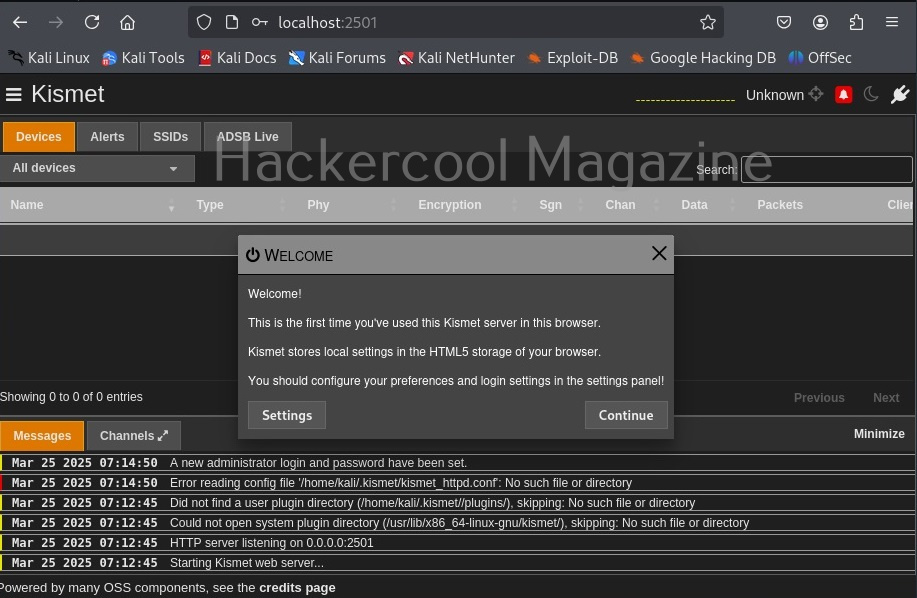
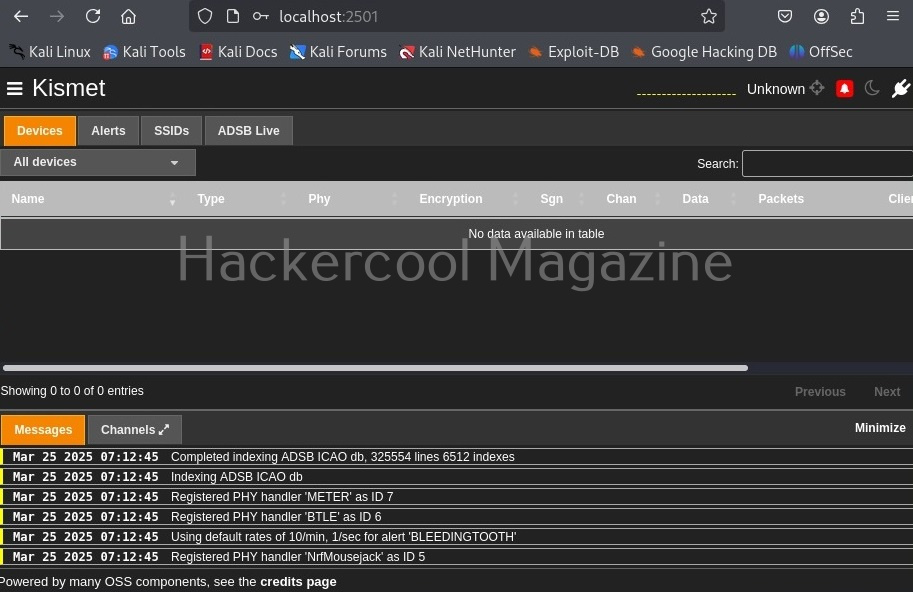
Kismet will show you all the wireless access points it has detected.

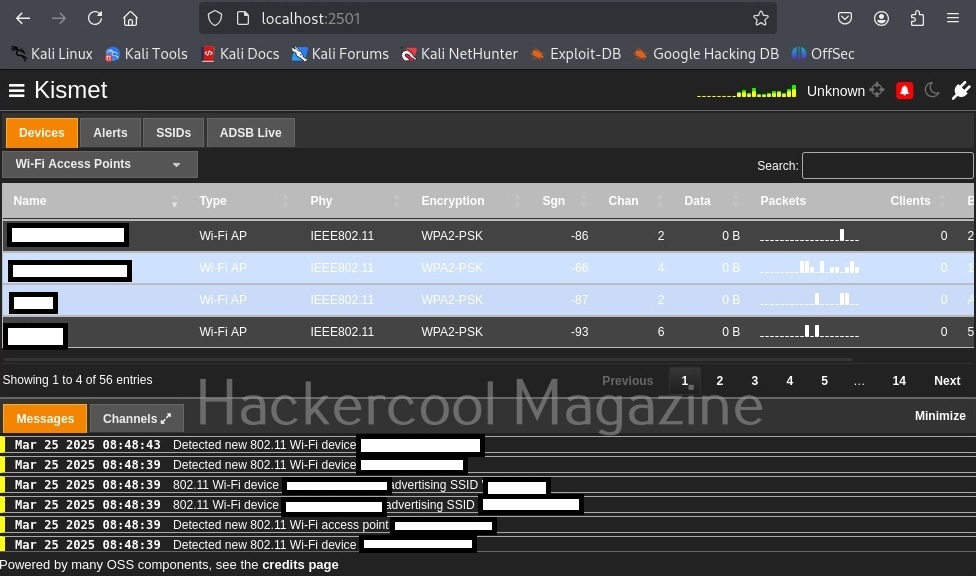
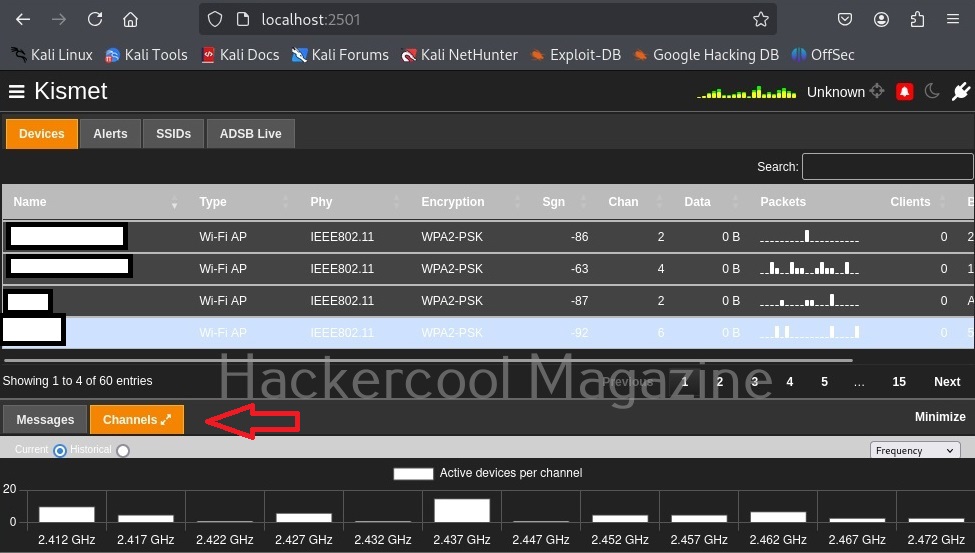
While the top shows all the wifi access points and client devices, in the bottom you can see messages. Just beside the “messages” tab there is a “Channels” tab where you can see all the channels and active devices on each channel.

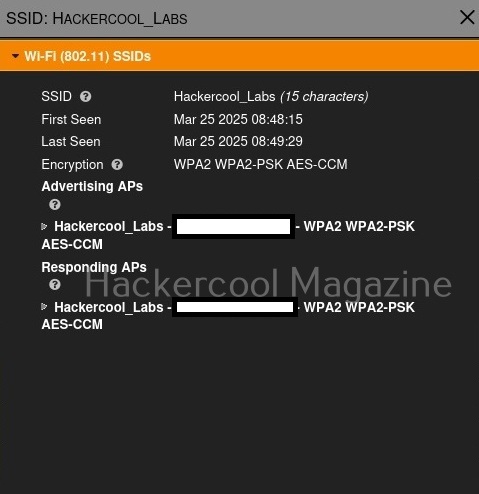
Coming to the top, while devices tab shows you all the wireless devices, clicking on the SSIDs tab displays all wireless access points. You can even search for a access point of your choice. For example, let’s search for wifi access point named “Hackercool_Labs”.

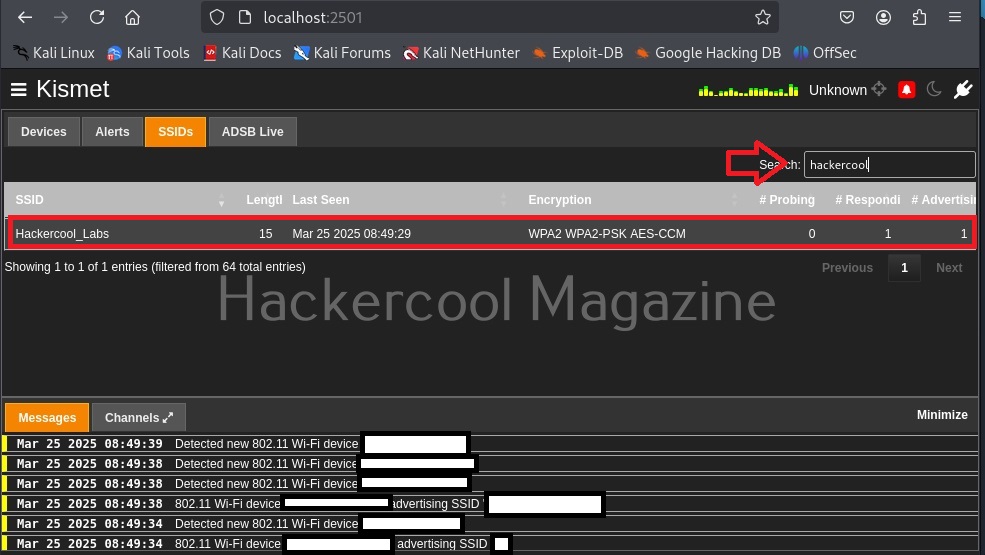
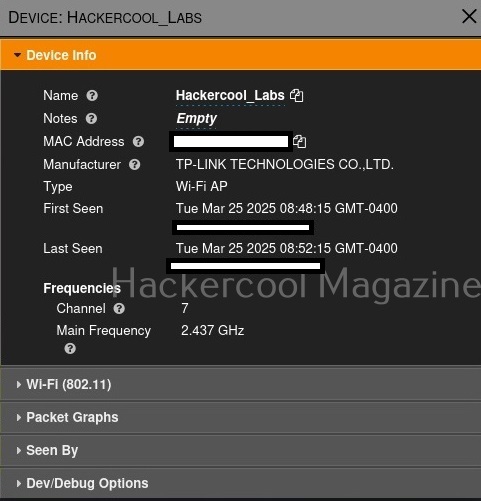
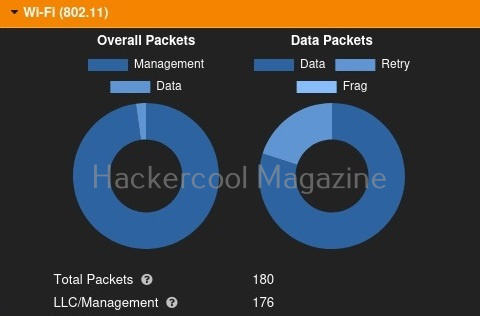
Clicking on the resulting entry shows more details about the wireless access point as shown below. We can see that the access point is a router from TP-Link.

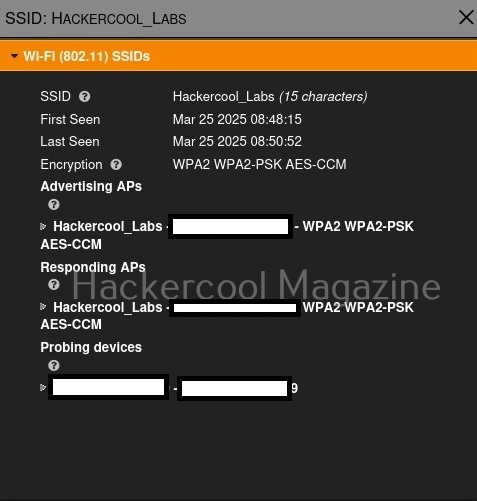
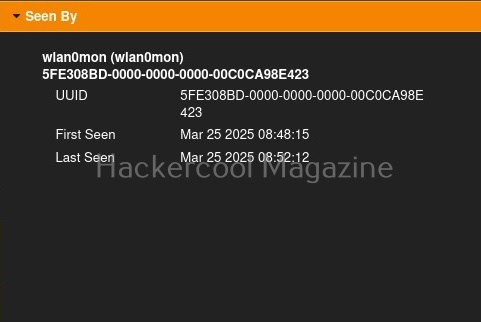
It will also show the MAC addresses of the devices or clients connecting to this particular access point as shown below.

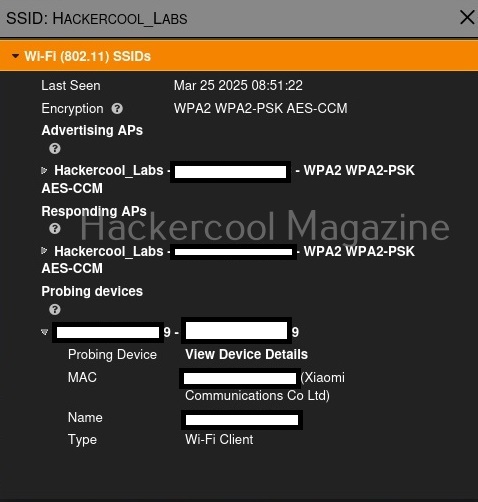
We can even learn more about the devices connecting to this access point. For example, the device that connected to our target access point is a mobile from Xiaomi. Similarly, we can identify other devices like cameras, smart devices etc.

We can learn the channel on which it is running and its frequency.

To the top left, there is a kismet menu.

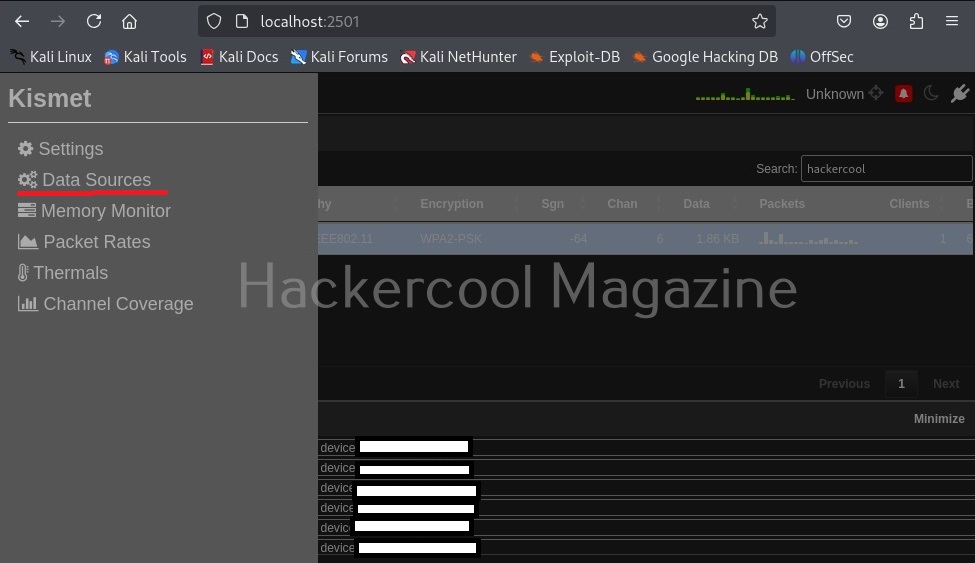
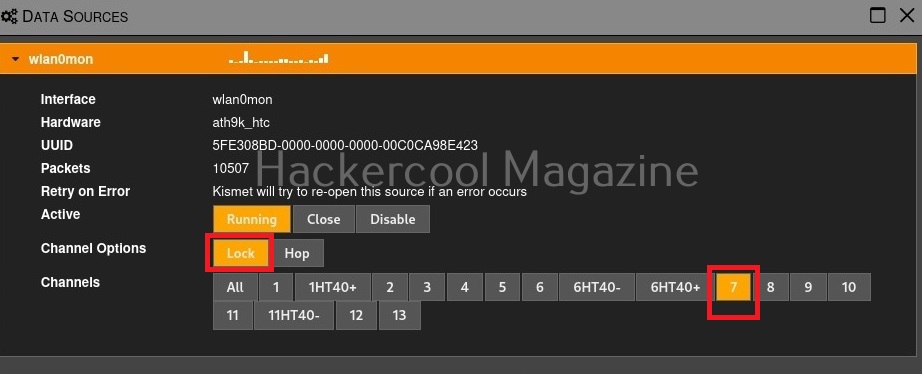
Click on “Data sources”. This will give you information from where your data is coming.

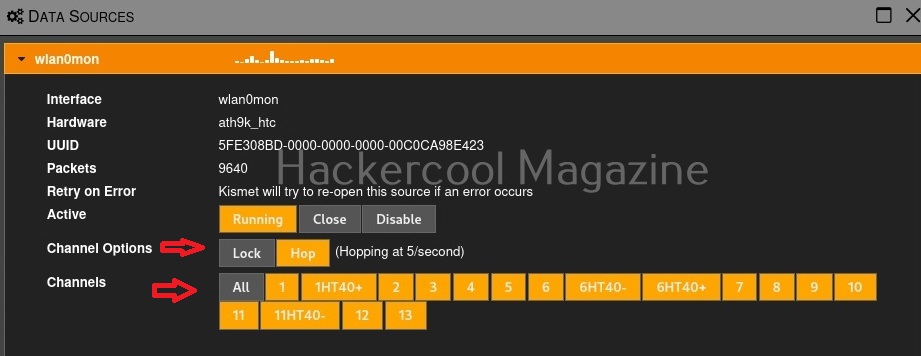
By default kismet hops from one channel to another channel (channels are explained in our wifi hacking article) to collect information. You can even lock kismet to a single channel. For example, say 7.

That’s all for now. In our future updates we will show you what more you can do with kismet. Learn about wifipumpkin3 tool.

Posted on

Beginners guide to OllyDbg

Hello, aspiring ethical hackers. In our previous blogpost, you learnt about reverse engineering. In this article, you will learn about OllyDbg, a debugger that is used to reverse engineer programs.

OllyDbg is an X86 debugger that is used to perform binary code analysis even when source code is not available. It can trace registers, switches, tables, constants, strings, recognize procedures, API calls and can even locate routines, object files and libraries. At present, this debugger can only disassemble binaries compiled for 32 bit processors.

Let’s see how this tool works. For this, I will be using Kali Linux as OllyDbg is available in its repositories.

Note that OllyDbg can only run on Windows systems. To run it on Kali, you need to install wine.

After wine is successfully installed, you can start Ollydbg using command shown below.

ollydbg

If it shows up wine error like this, just use the command shown below to fix it.

mv ~/.wine ~/.wine.old

Now, OllyDbg should start normally. The interface looks as shown below.

To see the working of Ollydbg, we need an executable file to disassemble. To help you understand how OllyDbg works in detail, I have written a simple program in C. The program is nothing new. It just adds two numbers provided by the users and displays the result. I name it “hc_app.c”.

Then I compile it as shown below to get an exe file named “hc_app.exe”.

Let’s first check if the program works as expected.

The program “hc_app.exe” is working as expected. Now, let’s load this into OllyDbg. This can be done by dragging hc_app.exe to OllyDbg or by going to File menu>Open (F3) as shown below.

This will open file explorer.

Navigate to the location of the app we just created and select it.

Doing this will open a terminal as shown below.

Minimize the terminal window for now. After minimizing it, you will see this on OllyDbg.

If you are a normal human like me, you will not understand anything. This is assembly code. The interface of OllyDbg is divided into 4 sections.

The first section is CPU window. This contains all virtual addresses of instructions. This window is located to the upper left of OllyDbg.

The second section is located to the upper right of the program and contains CPU registers.

The third section is located to the lower left. This has data residing in memory.

The fourth section, located to the bottom right is the stack.

Apart from this, I have assigned number ‘5’ in yellow. It shows if the program we loaded (hc_app.exe) is paused or running. Before doing anything, go to the Debug menu and hit “Run”. Now, bring forward the the command window we minimized earlier. It will change to this.

That’s all good. Now, let’s make something sense out of what looks like gibberish. Right click inside the CPU window, a menu should open. Select “Search for” and in the sub menu “All referenced text strings” as shown below.

What we are doing is searching for all text strings referred to in the program. This will give output as shown below.

Here, you can see “Enter two integers:” and “The final number is :”. You remember something from the source code of the program. But note here that, we don’t have access to source code and only loaded the compiled program (hc_app.exe). To the left, highlighted in red, you can see the address at which this string is present. The address is “00401576”. Go to that address in CPU window.

See the disassembled code here. It is this.

MOV DWORD PTR SS: [ESP], hc_app.00411044

The important thing here is the address “00411044”. Pointers in C point to a memory address. So, this command is pointing to a memory address “00411044”. Once again right click in CPU window select “Go to” this time and select “Expression” (shortcut for this is CTRL+G).

In the window that opens, enter address value as shown below and click on “OK”.

You should see this in CPU window. At address “00411044”, you should see a command “INC EBP”. Right click on that command and go to Binary>Edit as shown below.

A new window opens as shown below.

Observe the ASCII value. It is ‘E’. Similarly do it for next four commands.

Here are the combined ASCII values. They are ‘E’ ‘n’ ‘te’ ‘r’. What does it become? “Enter”.. I think you have figured out where this is going. This is part of the text, “Enter two integers:”. Right.

Now let’s do one thing. Change the ASCII value of ‘E’ ‘n’ ‘te’ ‘r’ to ‘H’ ‘E’ ‘LL’, ‘O’. respectively as shown below.

Now, when we go to debug menu and run the code again, instead of “Enter Two integers” we got “HELLO two integers” as shown below.

Here, you can see that we have successfully altered the code of a program without even knowing its source code. Next, learn how to perform static analysis of a program or malware with PEframe.

Posted on

Linux exploit suggester: Complete guide

Hello, aspiring ethical hackers. In our previous blogpost, you learnt about various linux privilege escalation techniques. In this article, you will learn about Linux exploit suggester, a script that helps us in elevating privileges on a Linux system.

Linux exploit suggester assists in detecting security deficiencies of a Linux kernel or Linux machine and suggests exploits for the vulnerabilities detected. It does this by assessing exposure of kernel to publicly known exploits. Obviously, this script should be run on target system after gaining access. Let’s see how this tool works. For this, I will be running this script after transferring it to target Ubuntu 20.04 machine after gaining a shell. The simplest way to run this script is using the command shown below.

./linux exploit suggester

As you can see in the above images, this script found 81 kernel exploits and 49 user space exploits. Moreover. it suggested the vulnerability and also an exploit for this. For example, in this case, the target system is vulnerable to DirtyPipe, Pwnkit vulnerabilities etc.

You can even run Linux exploit suggester by supplying the kernel information as shown below.

You can even supply the entire output of “uname-a” command by using the “-u” option.

Check security settings of the target system (–checksec)

This tool can also check most security settings in your Linux kernel using this option.

View only kernel space exploits

Setting this option shows only kernel related exploits for the target kernel.

View only userspace exploits

Setting this option shows only userspace exploits.

Display sources (-s)

Setting this option not only lists the exploits but also downloads the source code of the exploits.

The sources of the exploit are in the format of zip archive.

Download binaries (-b)

Setting this option downloads binaries of the exploit code if available. Binary exploits can be executed directly.

Get more detailed view (-f)

Setting this option displays a more detailed view of the exploit.

Get a brief view (-g)

Setting this option displays only brief information about found exploits.

After getting the exploit information, all you have to do is execute the exploit to elevate privileges on the target linux system. Next, learn about linux post exploitation after gaining elevated privileges.

Posted on

Windows privesc check: Complete guide

Hello, aspiring ethical hackers. In our previous blogpost, you learnt about Windows privilege escalation in detail and various techniques used for achieving this. In this article, you will learn about windows-privesc-check, a standard executable that helps users in elevating privileges on a Windows system.

Windows-privesc-check is a executable that can find misconfigurations in target systems that can help in elevating privileges on a Windows system. Let’s see how this tool is used. This tool needs to be run on the target Windows system after gaining access.

Windows-privesc-check can dump target system information in four formats. They are

  1. Dump: This option dumps information for you to analyze manually.
  2. Dumptab: This option dumps information in tab -data limited format.
  3. audit: Setting this option identifies and reports security weaknesses.
  4. Pyshell: This option starts an interactive Python shell.

Dump the drives (-D)

Setting this option dumps all the partition drives on the target windows system.

Dump event logs (-E)

Setting this option dumps all event logs on the target Windows system.

Dump user groups (-G)

Setting this option dumps all user groups present on the target system.

Dump all shares (-H)

Setting this option dumps all the network shares on the target system.

View installed software (-I)

All the programs that are installed on the target Windows system can be viewed using this option.

View all scheduled tasks (-j)

This option shows all scheduled tasks if any on the target system.

View driver kernel (-k)

This option shows kernel information of drivers on the target system.

View logged in users (-L)

View NT objects (-O)

View directory tree of program files (-p)

View Registry settings and permissions (-r)

View processes running on target system (-R)

View all users on the target system (-U)

View all files and directories (-A)

This option shows all the files and directories on the target system and saves the ouput into a file named wpc.

Perform all simple checks (-a)

This option is used to performs all simple checks on the target system.

Saving report

Windows-privesc-check has lot of options while saving the output.

Report only privilege escalation issues relating to current user (-c)

Setting this option reports only the privilege escalation issues that can be exploited by users specified by you.

Same as above but users are specified in a file.

Setting this option allows you to ignore vulnerabilities that can be exploited by specific users. Windows-privesc-check ignores privilege escalation issues that are exploitable by users in the you set.

Same as above but the ignored list is specified is a file.

Setting the above option reports all weaknesses that are exploitable by all the users. This is known as zero-trust policy.

Learn about Unix-privesc-check, a tool that helps in elevating privileges on a Linux system.

Posted on

Complete guide to WebSploit

Hello, aspiring ethical hackers. In our previous blogpost, you learnt about man in the Middle attack (MiTM). In this article, you will learn about WebSploit, which is used in MiTM attacks. Websploit is a MiTM framework that can perform various MiTM attacks like arp spoofing, http sniffing, network scanning, wireless scanning, performing de-authentication attacks on wireless networks, creating Wi-Fi fake access points and spamming Wi-Fi network.

Let’s see how this tool works. For this, we will be using Kali Linux as attacker machine as WebSploit is available by default in its repositories. As target system, we will be using Metasploitable 2 installed as part of our virtual hacking lab.

WebSploit can be started using command shown below.

To see all the attacks that can be performed with this tool, use command “show”.

Let’s start by performing network scanning attack with WebSploit. To use a module, use the “use” command. To see all the options a selected module needs, we have to use “options” command as shown below.

The “scan_network” module just requires the IP address and range of network. You can set the options required using “set” command like Metasploit. After all the options are set, execute the module using “execute” command.

As you can see in the above image, all LIVE systems are shown. Similarly, we can perform ARP spoofing attack as shown below. This attack requires two options. The target and gateway IP addresses.

In our previous article on sniffing, you learnt how to sniff HTTP traffic. WebSploit can also be used to perform HTTP sniffing attack. We can perform HTTP sniffing attack as shown below.

As soon as we type “execute” command, this module starts sniffing HTTP traffic. On Metasploitable2, there is DVWA installed by default. From a browser, go to that app.

You can see that the DVWA login page is on HTTP and hence data is transmitted in clear text. Login into DVWA with the credentials shown on the same page.

As soon as you do that, on the attacker system, you can see the credentials captured on WebSploit.

Very soon we will update this article with other attacks that can be performed. Until then, learn about tcpdump tool, an open-source data-network packet analyzer.