Hello, aspiring ethical hackers. In this blogpost, you will learn about IP spoofing or IP address spoofing. To understand IP spoofing, you need to first understand what is an IP address?
What is an IP address?
Every house has an address no matter in which nation it is around the world. This address helps in identifying the location of the house. Just like physical houses, every computer too has an address. This address is known as Internet Protocol (IP) address. This IP address is used to identify the computer, laptop or any digital device around the internet.
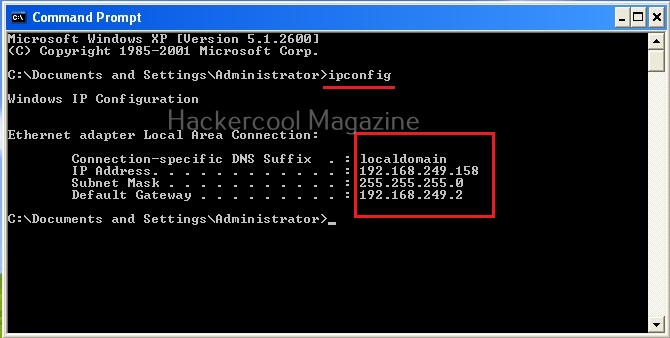
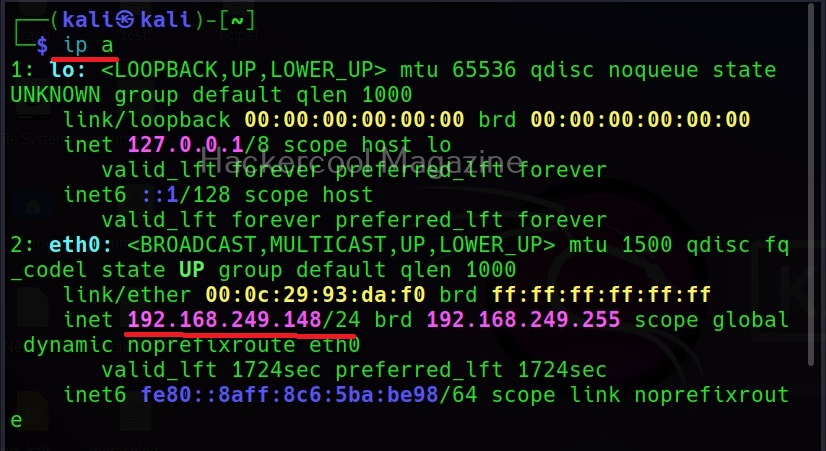
I wouldn’t go all about IP addresses here, but I think this blogpost is a good start. To stick with basics, you can view the IP address of your device using the command “ipconfig” in Windows and “ip a” in Linux.
The IP address is needed for communication between various devices over internet. If your computer or mobile device doesn’t have the IP address, it cannot communicate over internet.
What is IP spoofing?
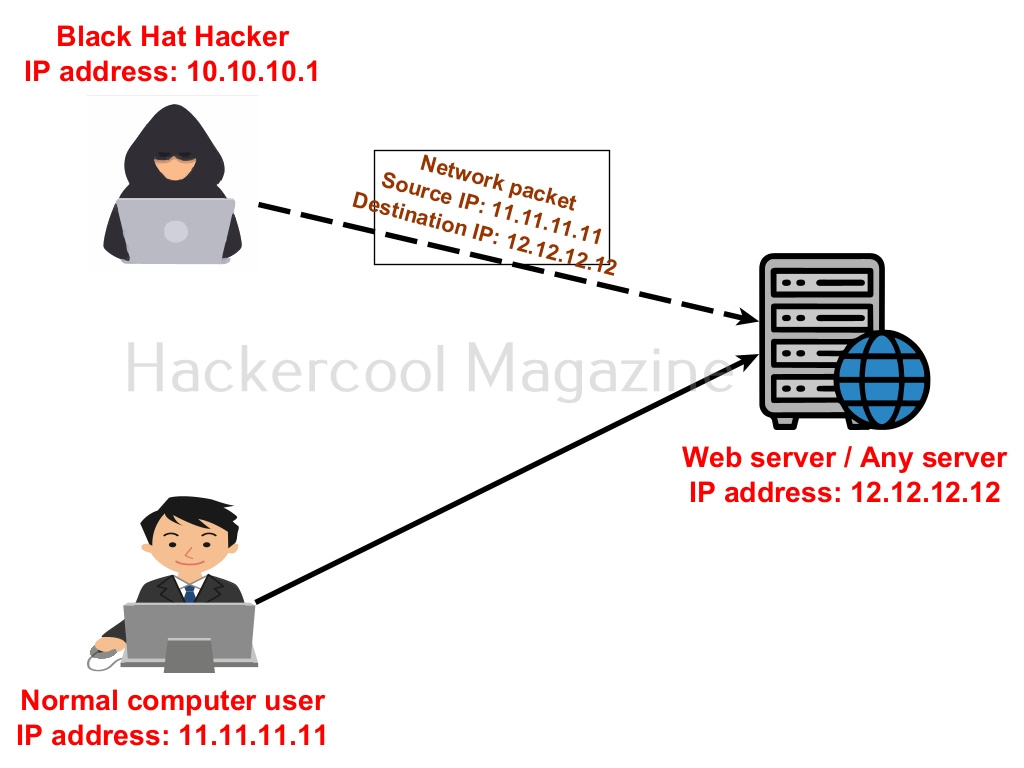
Well, let’s now get to the original topic of this blogpost. IP spoofing is the process of spoofing your IP address over the internet. It means changing the IP address of your device to something else other than assigned to your computer.
Why is IP spoofing needed?
How many times have we seen getting meterpreter session on our blog and in our magazine Well, in these cases, attackers IP address can be easily identified by viewing logs on the target system. In hacking, Black Hat Hackers spoof IP addresses to hide the source of their attack. IP spoofing is also used for genuine purposes like to protect their privacy.
Methods of IP spoofing
There are various method by which IP address can be spoofed.
1. Black Hat Hacker’s technique:
Black Hat Hackers often source their hacking attack through other IP addresses to hide their identity and to prevent tracking their hacking activity. Many computers in Fortune 200 companies are provided for sale on the dark web with access. Hackers buy access to these computers and source their hacking attacks from these systems. So, even if cybersecurity investigators detect the hacking attack, they can’t track the source to the original IP address of the hacker.
2. Proxy server:
A proxy server is a system or server that acts as a gateway between users and the internet. When they visit a website through a proxy, the IP address of the source computer is not shown and the IP address of the proxy server is logged on the target server. This is often used to bypass internet censorship.
3. Virtual Private Networks (VPNs):
A virtual private network (VPN) is a mechanism that creates a secure connection between the source and target system. It uses encryption to create this secure connection.
Hacking attacks that use IP spoofing
1. DDOS attacks:
While performing a DDOS attack, attackers often use spoofed IP addresses to overwhelm the target server or website with requests.
2. Man in the Middle attacks (MiTM):
Packet sniffing attacks or Man in the middle (MiTM) attacks also use IP spoofing.
See how to spoof your IP address in Kali Linux.