Posted on

Complete guide to Wapiti

Hello, aspiring ethical hackers. In our previous blogpost on web application hacking and web server hacking, you learnt about various web vulnerabilities. In this blogpost, you will learn about Wapiti a web vulnerability scanner.

It is a very good practice to learn about the vulnerabilities and weaknesses in a website or web application before they hackers find bout them. Web vulnerability scanners play a very important role in detecting vulnerabilities. Wapiti is one such vulnerability scanner thats written in Python.

Unlike other vulnerability scanners, Wapiti works as a “Black Box” vulnerability scanner that instead of studying source code of the target web application, works by fuzzing and scanning the pages of web application, extract link forms, attacking the scripts, sending payloads, finding out error messages, special strings and other abnormal behaviours.

Let’s see how to find vulnerabilities using Wapiti. For this, we will be using Kali Linux as this tool is installed by default on Kali Systems. As target, we will be using Mutillidae web application on Metasploitable 2. See how to setup this virtual hacking lab.

The simplest way to use Wapiti is to just supply it with the target URL as shown below.

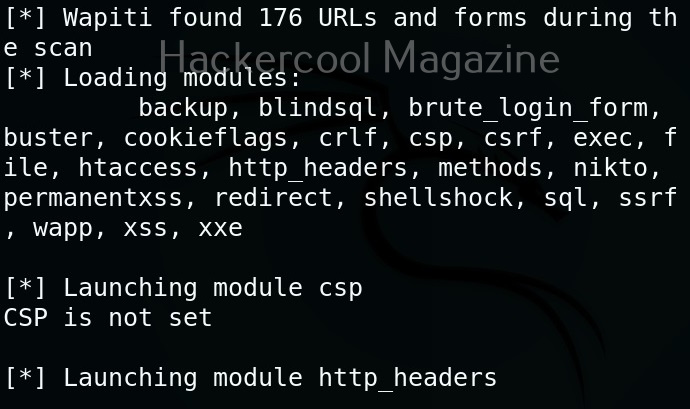
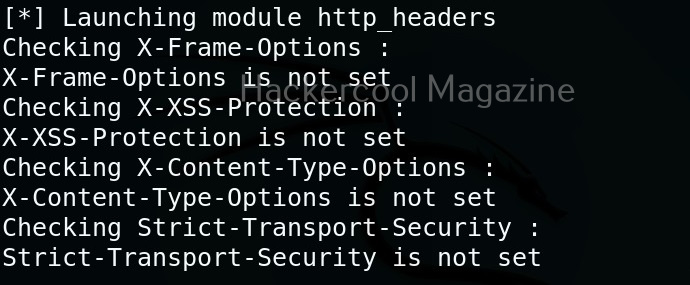
Then, Wapiti starts scanning the target as shown below.

Scope

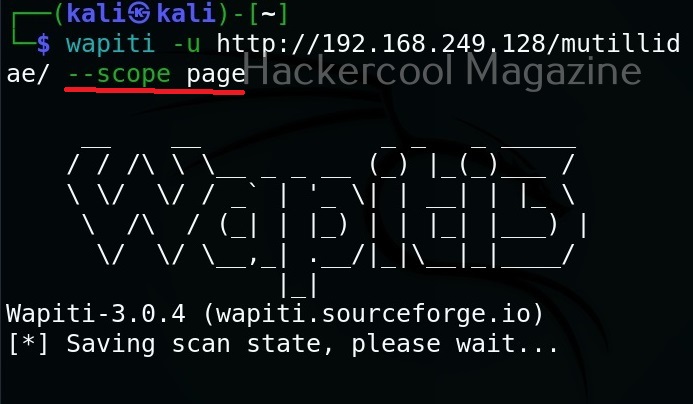
Scope option of wapiti specifies it to what to scan. The scope option of wapiti takes four values: URL, page, folder, domain and punk. Here is the detailed explanation about these values.

  1. URL: Setting this will only scan and attack the exact base URL given with -u option.
  2. PAGE: Setting this as scope value will attack every URL matching the path of the base URL.
  3. FOLDER: This will scan and attack every URL starting with the base URL value. This base URL should have a trailing slash (no file‐name).
  4. DOMAIN: Setting this as scope value will scan and attack every URL whose domain name matches the one from the base URL.
  5. PUNK: Setting this value will scan and attack every URL found whatever the domain. Think twice before using this for scope.


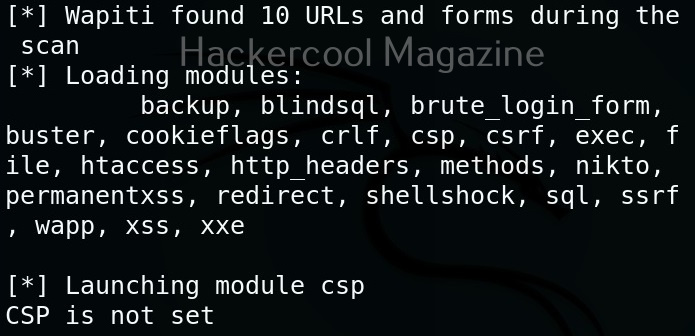
Let’s set the scope to “page” for now.

View all the modules (

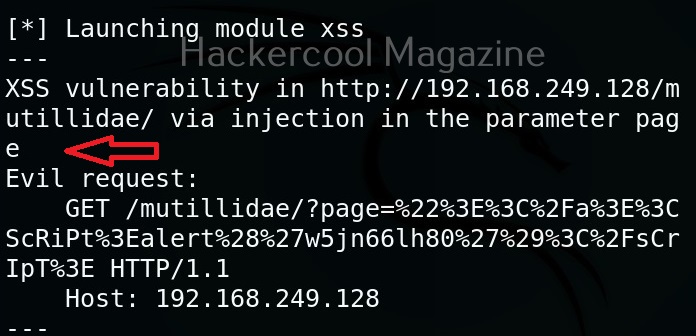
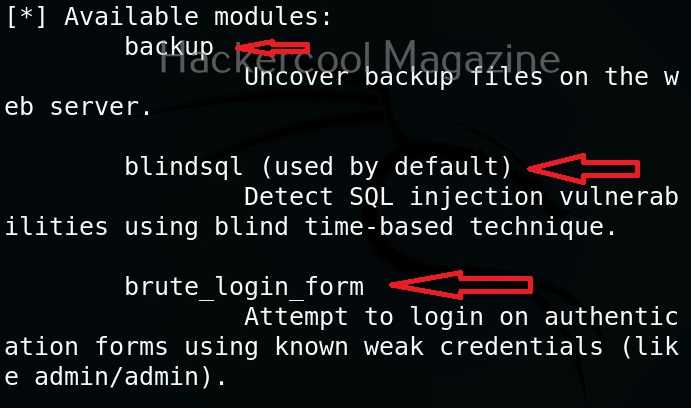
Wapiti has many modules that help in vulnerability scanning. You can view all the modules using the “list modules” option.

Select a single module

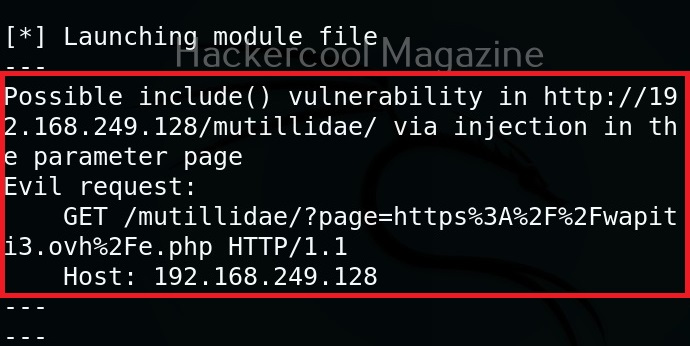
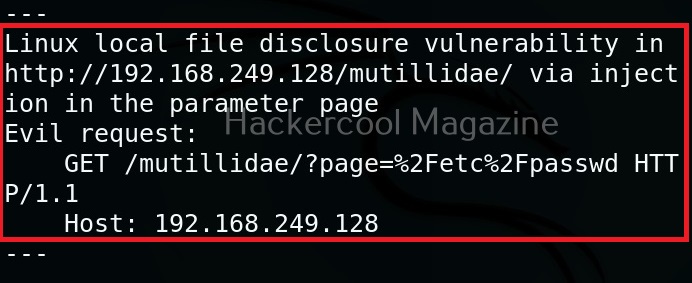
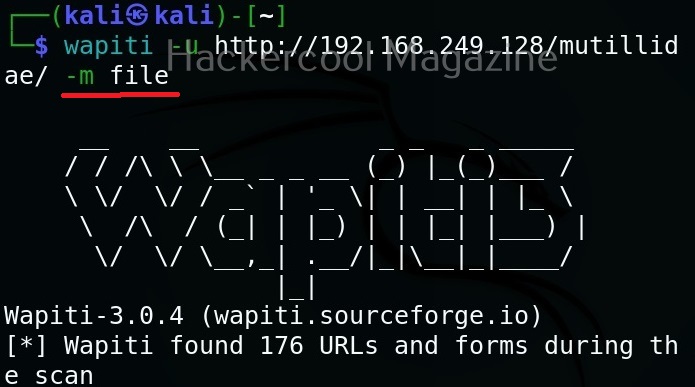
You can select just a single module using the “-n” option. For example, let’s load the file module.

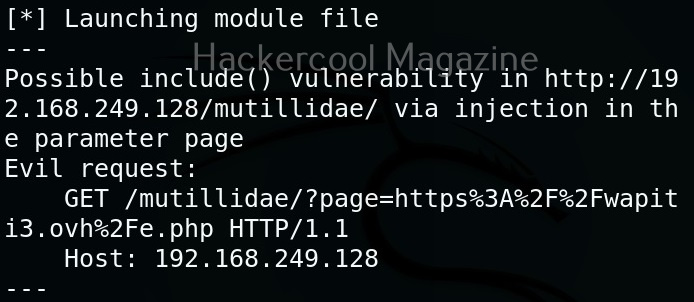
As you can see in the above image, a include vulnerability has been detected in the target web app.

Don’t resume the scan (–skip-crawl)

Sometimes, we abort a scanning session before it gets completed. When you start a new scan with Wapiti again, by default it resumes the aborted session by crawling the URLs again. If you don’t want to resume the previous scan from URL crawling, you can use this option. By using this option, Wapiti will attack only currently known URLs.

Resume from crawling

This option us useful in cases where the scan was previously aborted after wapiti started attacking. When a session is restored, the default behavior is to skip crawling. However, we can use this option to continue the scan process.

Flush attacks

This option specifies wapiti to forget everything about discovered vulnerabilities and which URL got attacked by which modules. Only the crawling information of the scan will be kept.

Flush session

This option specifies wapiti to forget everything about the target for the given scope.

Saving the output to a directory

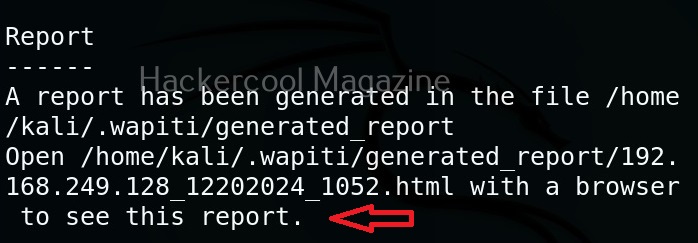
Like many tools, you can save the output of the scan of wapiti in a report. This option enables you to specify a directory for saving the report of the scan.

Format of the reports (-f)

You can use this option to specify the format of the report. The reports can be saved in json, HTML, txt and xml. formats. For example, let’s set the report to be txt format.

Posted on

Complete guide to Subfinder

Hello, aspiring ethical hackers. In our previous blogpost, you learnt what is footprinting and various techniques used for footprinting. In this blogpost, you will learn about subfinder, a tool that helps us in footprinting.

Subfinder is a sub domain discovery tool that queries and retrieves valid sub domains for a given domain or website. It is a simple tool that uses passive subdomain enumeration for this purpose.

Let’s see how to use this tool to perform subdomain enumeration. For this, we will be using Kali Linux as our attacker machine. Subfinder can be installed on Kali as shown below.

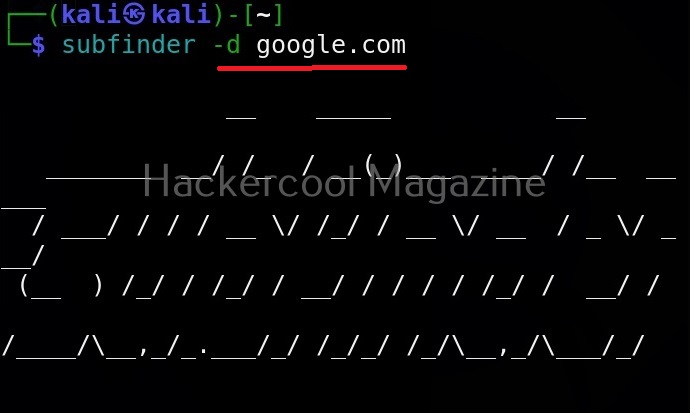
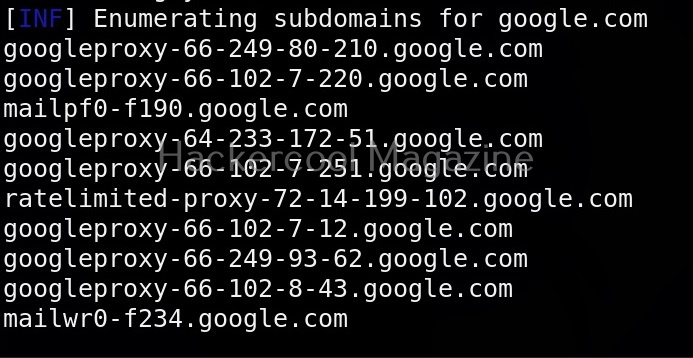
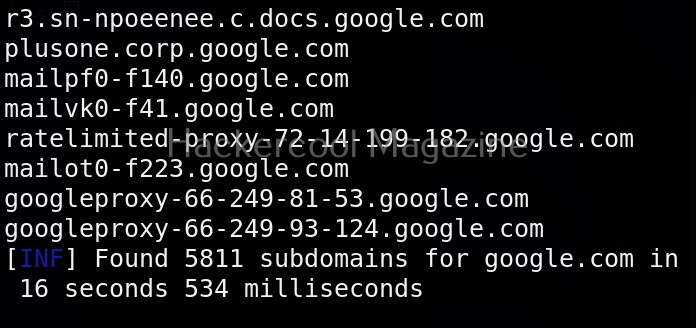
The simplest method to use subfinder to query a sub domain of a particular domain is as shown below.

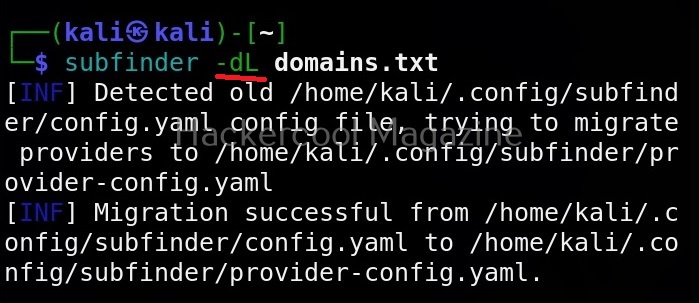
Specify multiple domains at once (-dL)

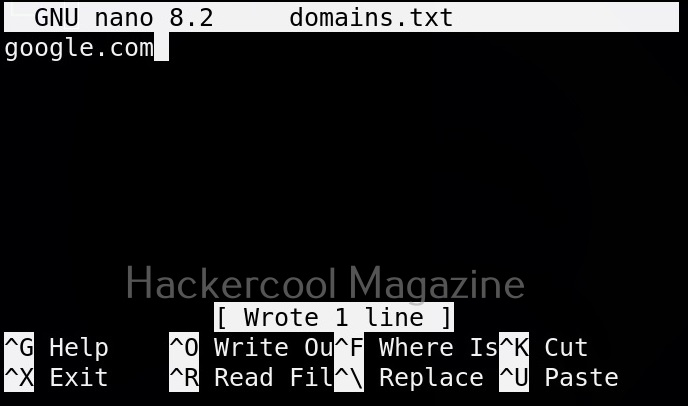
This tool can also query multiple domains at once. You can supply these domains using a file. For example, let’s create a new file “Domains.txt” and add a domain as shown below.

This file can be provided as input to subfinder as shown below.

View all the sources of this tool (-ls)

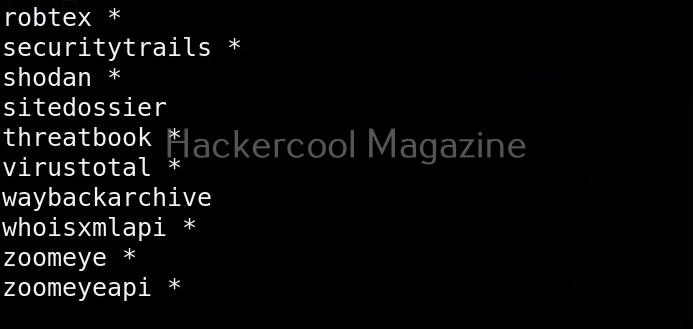
Subfinder collects information from a number of sources like AlienVault, Anubis, Censys, Shodan etc. You can view all the sources the subfinder tool queries using the command given below.

Query a single source (-s)

You can specify subfinder to query just one source using (-s) option as shown below. For example, let’s just specify GitHub and Anubis as sources.

Query all the sources (-all)

We can also specify this tool to query all the sources using the “-all” option.

Exclude some sources (-es)

We can even exclude some sources as shown below. For example, let’s exclude GitHub.

Display the source this tool queried in results (-cs)

We can even display source information to be displayed in output using the “-cs” option as shown below.

Saving output (-o)

You can save the output of this tool to a file as shown below.

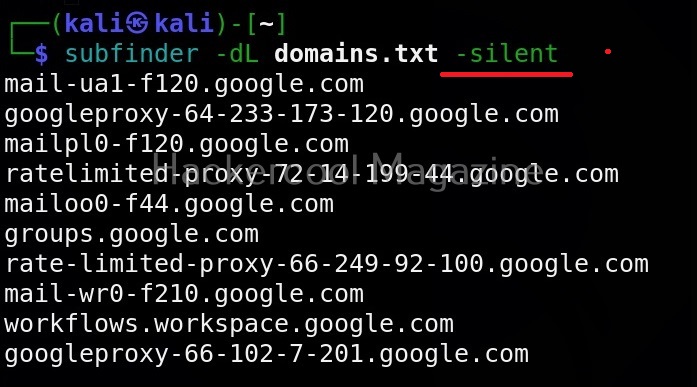
Silent mode

In this mode, sub finder just displays the sub domains it found and nothing else.

Posted on

Complete guide to Goldeneye tool

Hello, aspiring ethical hacker. In our previous blogpost, you learnt about Denial of Service (DoS) attack. In this blogpost, you will learn about goldeneye, a HTTP DoS Test Tool.

This tool helps us to test if a web server is susceptible to DoS and DDoS attacks in real-world. Like any DoS testing tool, it generates a large number of requests in short time. Let’s see how this tool works. For this, we will use Kali Linux as this tool is available by default in its repositories. It can be installed as shown below. To install it on other systems, it can be downloaded from here.

goldeneye_1

The simplest way to use goldeneye tool is to just provide the URL you want to test as shown below.

goldeneye_2

Different modes (-m)

By default, goldeneye uses GET requests to test a website. However, it has two other modes too: POST and RANDOM. You can set this modes using the “-m” option.

Goldeneye_3
Goldeneye_4

Number of workers (-w)

By default, goldeneye uses 10 workers running 500 connections each. However, we can change it using the “-w” option. For example, let’s set it to 20 workers.

Goldeneye_5

Number of connections (-s)

Similarly, we can change the number of connections using the “-s” option. Let’s change the number of connections to 1000.

Goldeneye_6

Debug mode(-d)

We can run goldeneye tool in debug mode using the “-d” option. Debug mode gives detailed information about the tests being performed.

Goldeneye_7

Posted on

Beginners guide to Lynis

Hello, aspiring ethical hackers. In this blogpost, you will learn about a tool called Lynis, the security auditing and hardening tool for UNIX based systems like Linux, macOS, BSD and others. It performs an in-depth security scan to test security defenses and provide suggestions for further system hardening.

This tool audits the following features on the system.

  1. General system information.
  2. System tools.
  3. Operating system.
  4. Boot and other services.
  5. Kernel vulnerabilities.
  6. Memory and processes.
  7. Users, groups and authentication
  8. Kerberos
  9. Shells
  10. File systems
  11. USB devices
  12. Storage
  13. NFS
  14. Name Services
  15. Ports and packages
  16. Networking
  17. Printers and Spool
  18. Email and messaging software
  19. Firewalls
  20. Web servers
  21. SSH and SNMP
  22. Databases
  23. PHP (in web server)
  24. Logging and log files
  25. Insecure services
  26. Banners
  27. Scheduled Tasks
  28. Accounting
  29. Time and synchronization
  30. Cryptography
  31. Virtualization
  32. Containers
  33. Security frameworks
  34. System tools and malware
  35. File permissions etc.

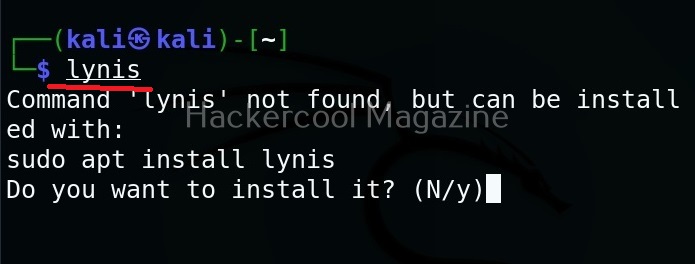
Let’s see how to run Lynis for the first time. For this, we will be using Kali Linux. It can be installed on Kali as shown below.

After the installation is successful, run the command shown below to run it to audit the entire system.

lynis audit system

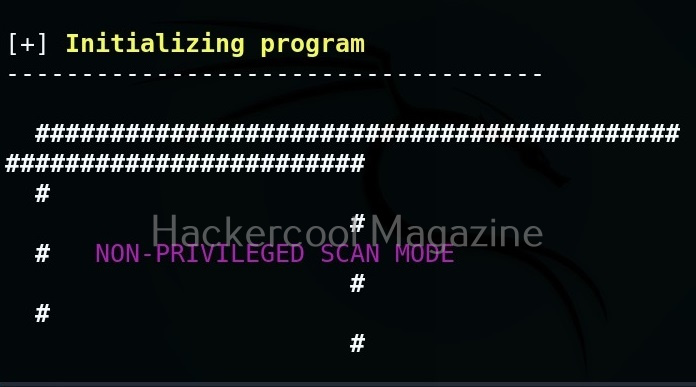
It runs as shown below.

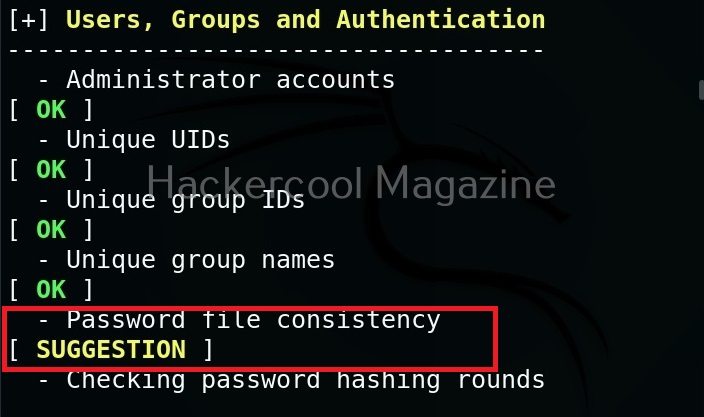
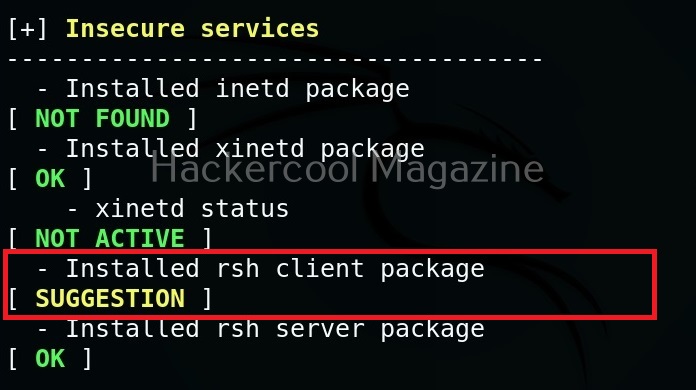
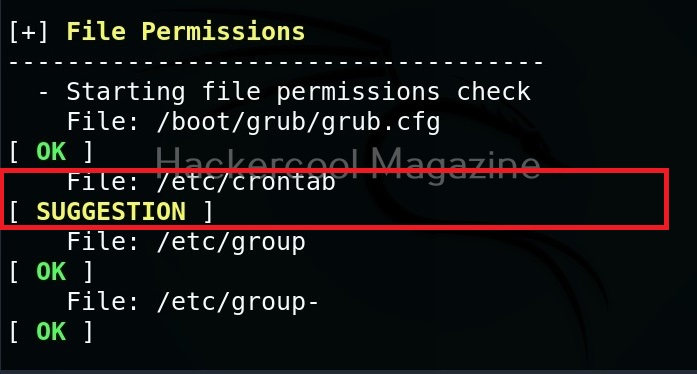
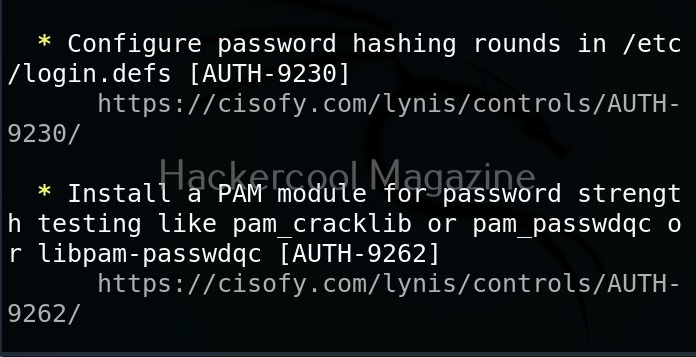
While auditing, wherever there is scope for hardening, lynis adds a suggestion as shown below.

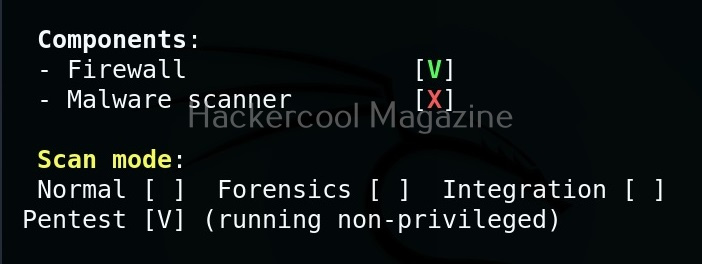
After the entire system is audited, Lynis provides summary of the entire audit as shown below.

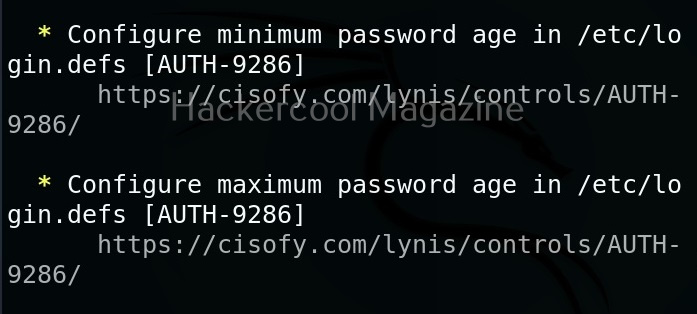
Below the summary, you can find each suggestion as shown below.

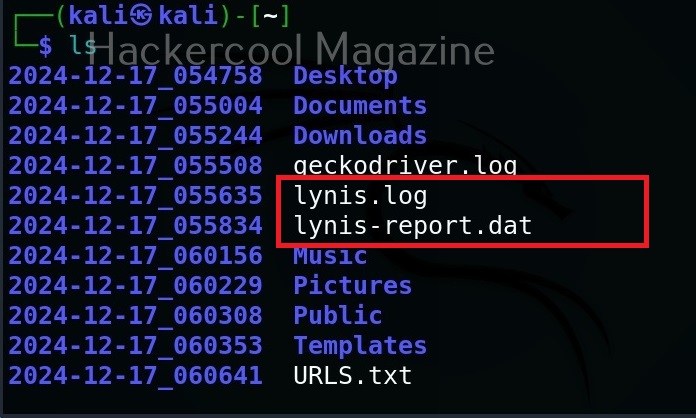
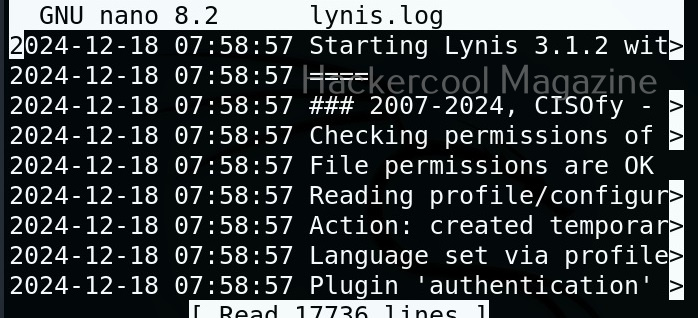
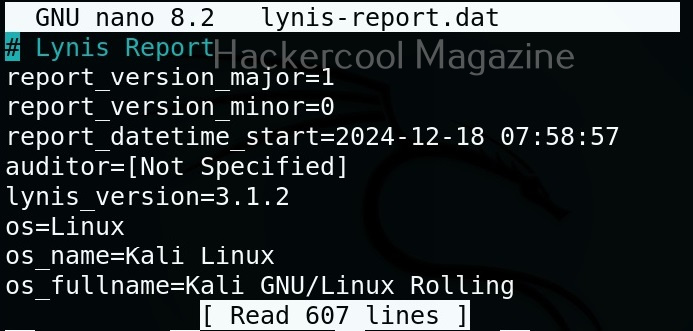
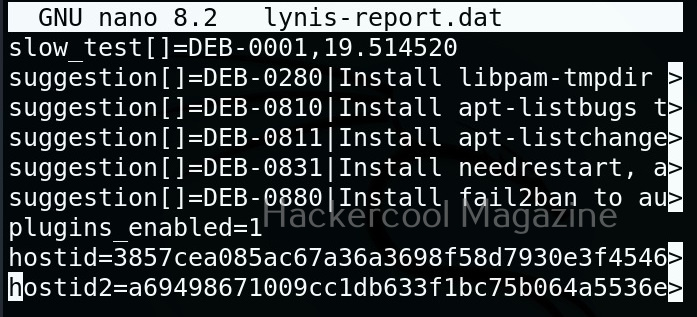
You can harden your system based on these suggestions. You can also find this information in the log reports of Lynis.

Posted on

Beginners guide to Eyewitness tool

Hello aspiring ethical hackers. In our previous blogpost, you studied about website footprinting. In this blogpost, you will learn about a tool called eyewitness which helps you to decide which website to focus on.

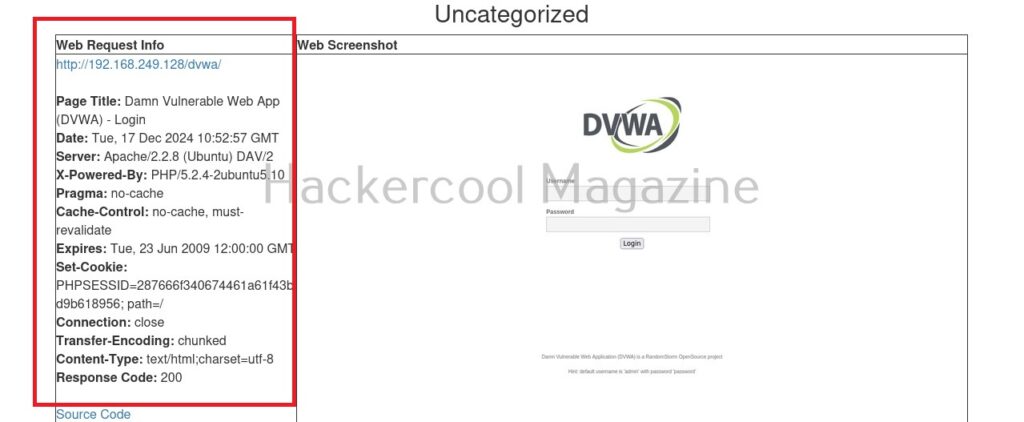
In ethical hacking, before trying to footprint a website, it would be good if we have a general idea about what websites to target first. For example, a company you are going to pen test may have multiple websites and sub domains. Before we jump into password cracking or exploitation or directory busting or perform any other attack, it would be good if we are first able to decide what website and URLs to target first. The role of eyewitness tool comes there. Eyewitness takes the screenshots of the URLs or websites you provide. Apart from taking screenshot of the URL, it will also capture any header info and default passwords.

Let’s see how to use this tool. For this we will be using Kali Linux as this tool is available by default in Kali repositories. As target, we will be using Metasploitable 2 installed in our virtual hacking Lab. It can be installed as shown below.

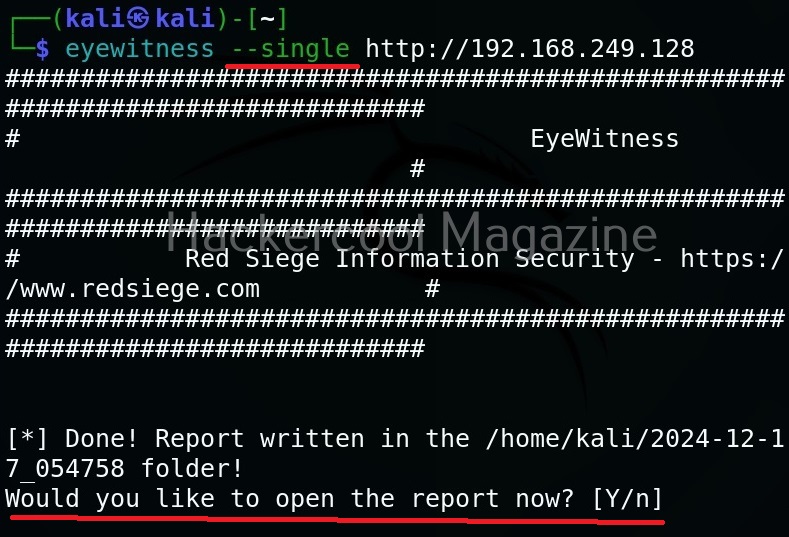
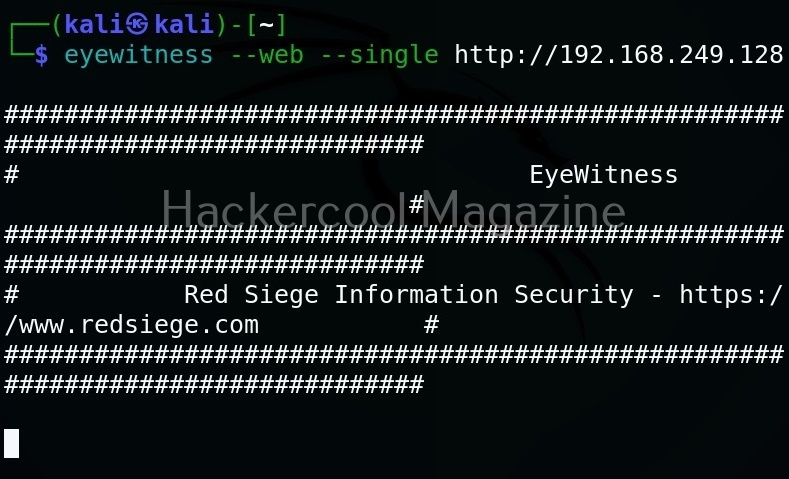
Target a single URL (–single)

You can take screenshot of a single URL as shown below.

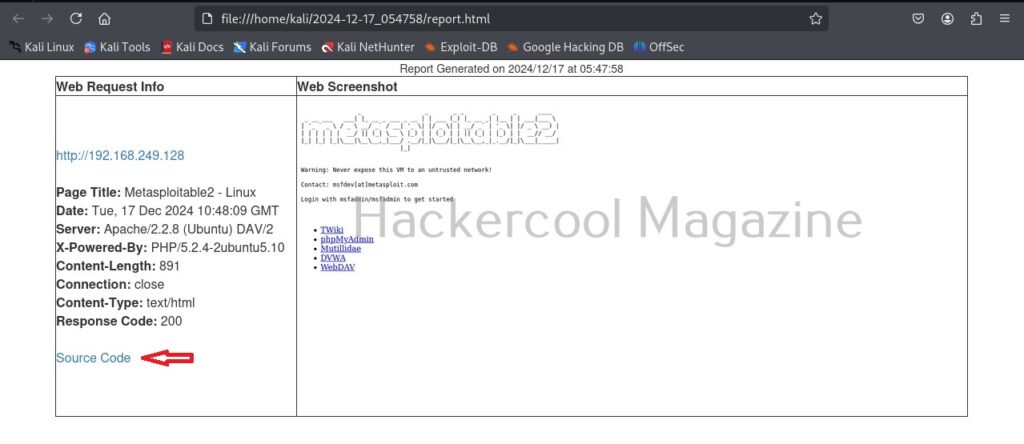
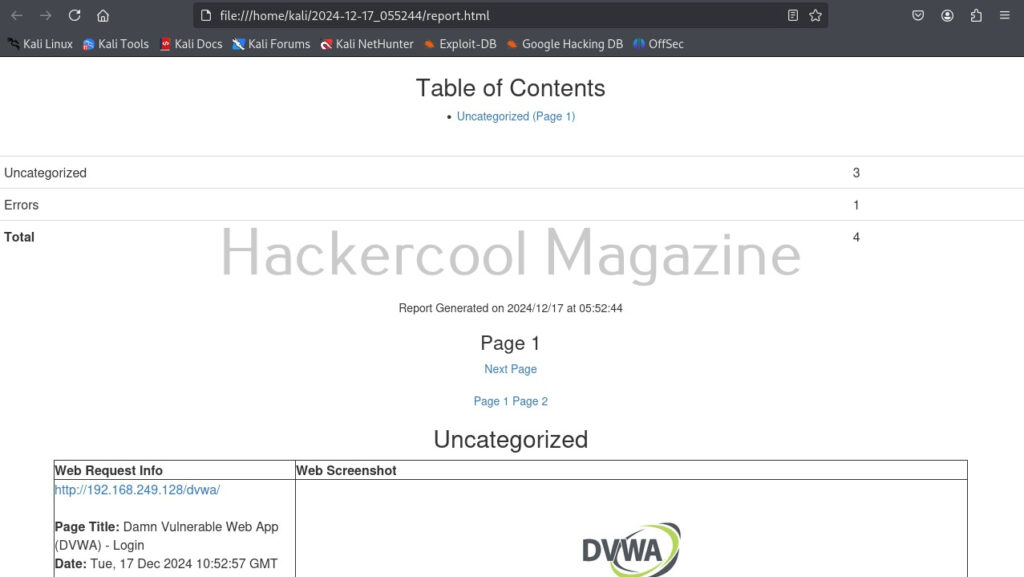
As soon as it writes a report for your target, it will ask you if you want to open the report. Click on “Yes”. It will open the report as shown below.

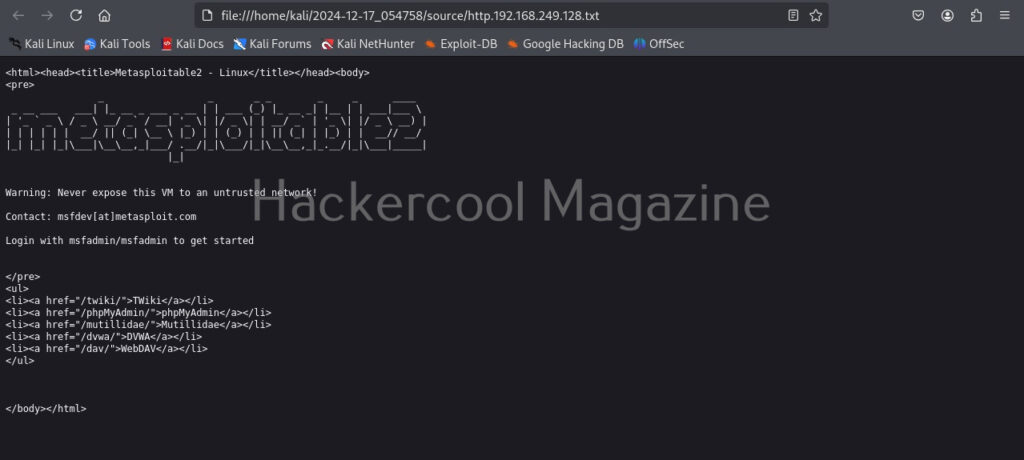
You can even view the code of the URL you scanned.

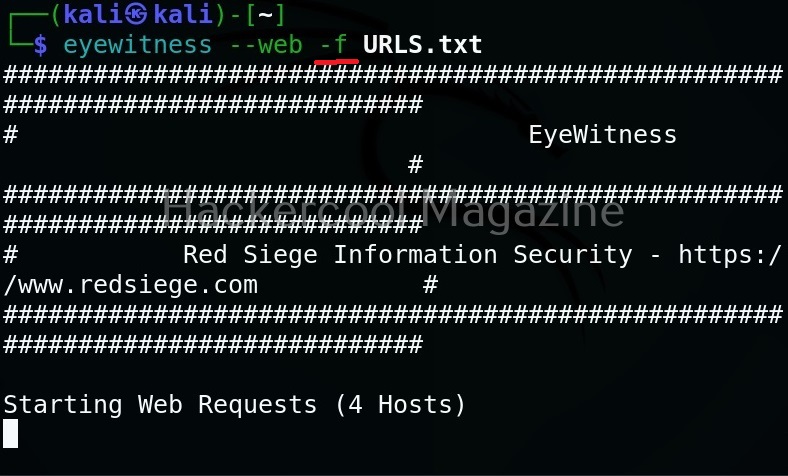
But the real power of eyewitness can be seen when we are targeting multiple URLs at once. For doing this, we will first create a file called URLS.txt and add some URLs we want to target as shown below.

Target multiple URLs (-f)

Multiple URLs can be targeted with this tool by specifying the above created file with (-f) option.

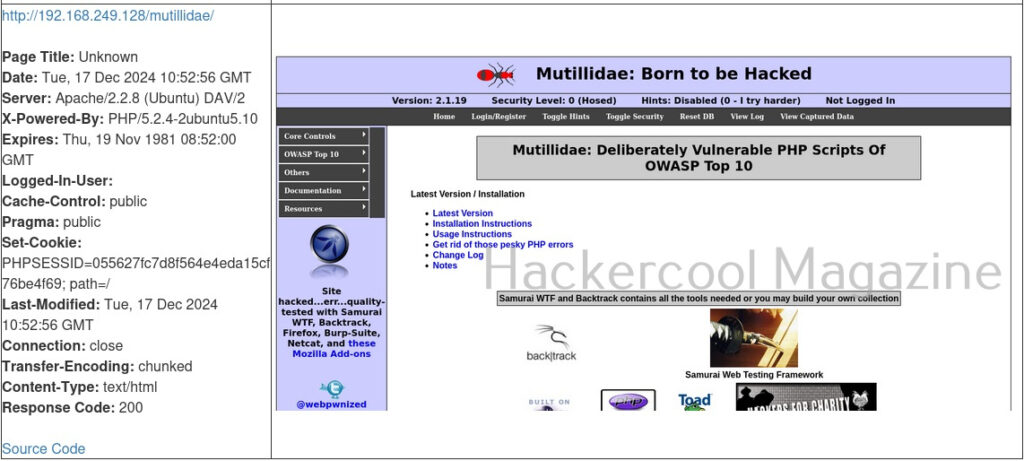
Here’s the report.

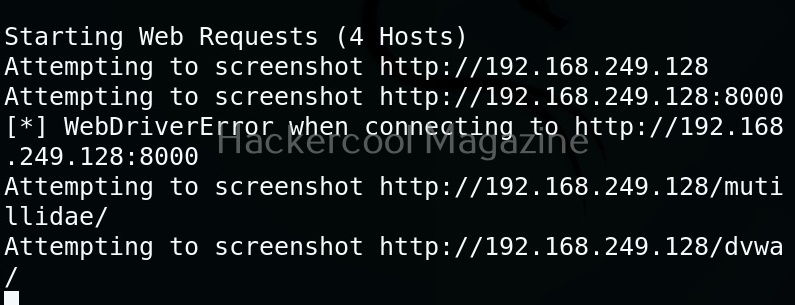
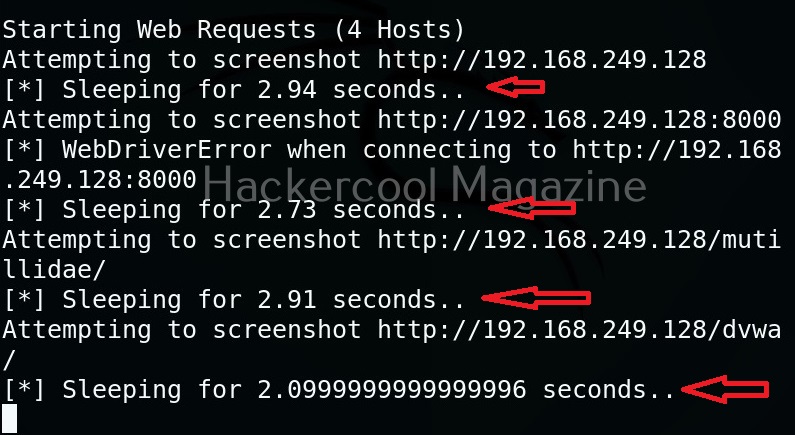
One of our URLs we targeted ended up in a error.

Skip DNS resolution(–no-dns)

In some cases, while using eyewitness tool, you may have to go through a VPN. In such cases, it is good to skip DNS resolution when connecting to the website. This option helps you to do it.

Resolve IP / host name for your target (–resolve)

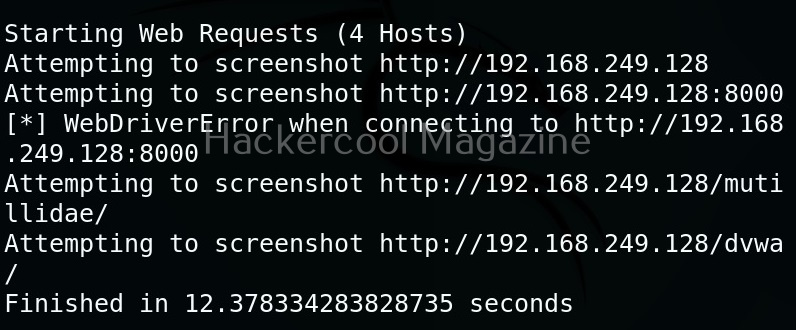
Time to wait while requesting an URL (–timeout)

By default, eyewitness waits for 7 seconds before it goes to take a screenshot of a new webpage. However, this can be changed with this option. For example, let’s change the timeout time to 1 second.

Add jitter (–jitter)

Using this option, we can randomize the URLs specified and add a random delay.

Add delay before taking a screenshot (–delay)

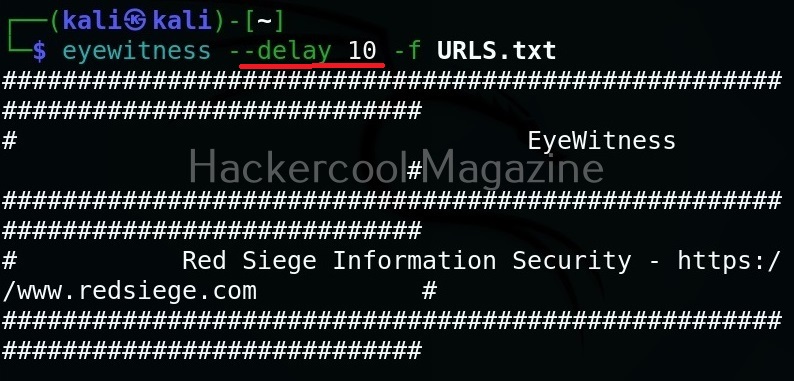
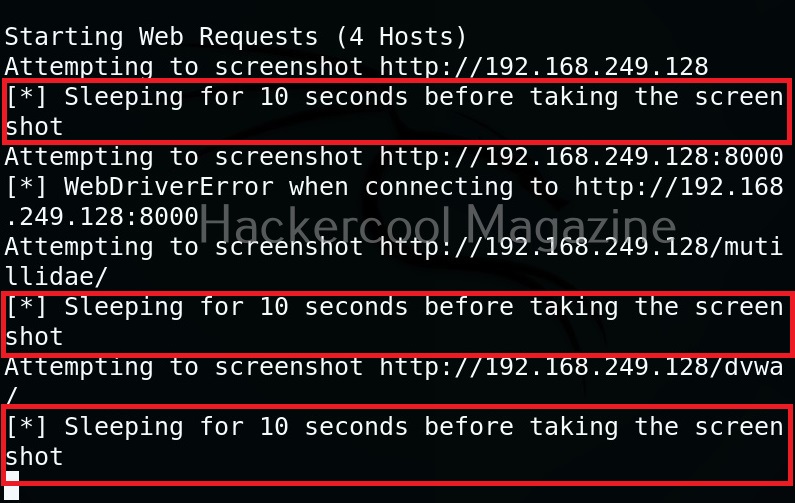
Using the option, we can add delay between opening of the navigator and taking a screenshot. This delay can be specified in seconds. For example, let’s add 10 seconds delay before taking screenshot.

Maximum retries (–max-retries)

This option specifies eyewitness tool how many retries it has to make if it fails to grab a screenshot on the first attempt.

Specify directory name for saving the report (-d)

This option is used to specify a directory name for saving the report.

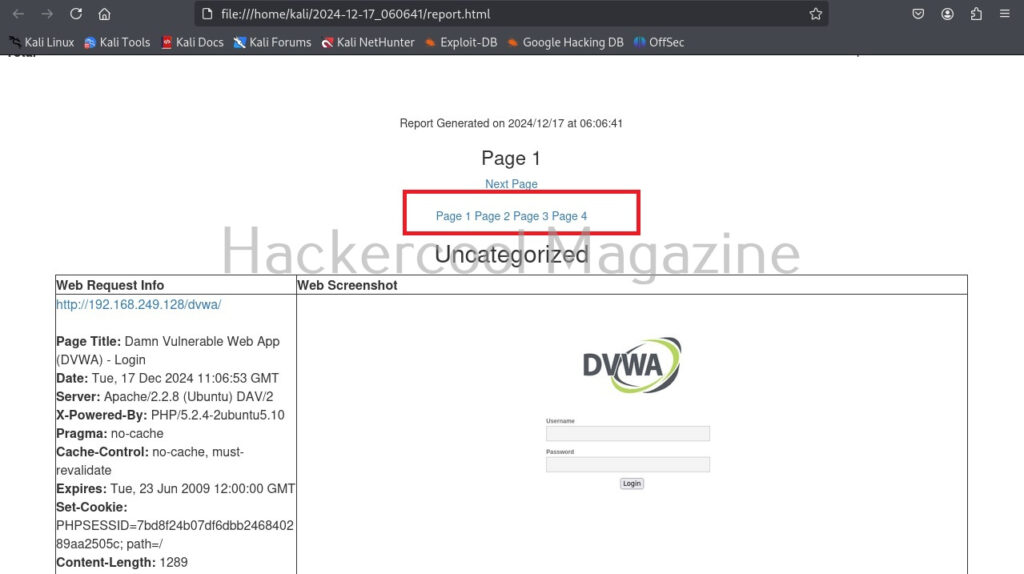
Number of results to show on one page (–results)

By default, eyewitness shows output for all the URLs given as input on a single page. This option can be used to specify how many results to show per page. For example, let’s set it to show 1 result per page.

As you can see, now, all the results are shown on separate pages.

You don’t want to be prompted for viewing the report (–no-prompt)

If you don’t want eyewitness to prompt you to open the report after finishing its work, you can use this option.