Posted on

Metasploit Framework: Beginners guide

Hello, aspiring ethical hackers. In our previous blogpost, you learnt in detail about Pen testing. In this blogpost you will learn about the perhaps the most popular penetration testing software suite, Metasploit Framework. Metasploit Framework (MSF) is free, open-source pen-testing suite that is used to execute exploits and develop code against a remote target machine. Although it sis made for penetration testers, it is also used by Black Hat Hackers around the world.

History

Metasploit was originally written by H.D.Moore, an American network security expert, open-source programmer and hacker. He has been the chief Architect of Metasploit Framework until his departure from Rapid7 company in 2016. Originally written in Perl, Metasploit was rewritten in Ruby programming language by 2007. In 2009, it was acquired by Rapid7. Metasploit is available for Windows, Mac and Linux. Metasploit is so widely used that it is included in every ethical hacker os like Kali and Parrot Security.

Structure of Metasploit

Metasploit Framework is the name given to the free version of Metasploit. The role of Metasploit in penetration testing comes after the stage of port scanning and vulnerability scanning (Information from tools such as NMap, Nessus and OpenVAS etc can even be imported into Metasploit). Metasploit is built with a modular approach. For beginners, Metasploit can be complex and a bit difficult to understand. Let’s learn in detail how to run Metasploit.

Let’s start with Metasploit modules. The most important modules of Metasploit are Exploit, Payloads, POST, Auxiliary, Evasion and Encoder modules. Let’s learn about each one of them now.

1. Auxiliary modules:

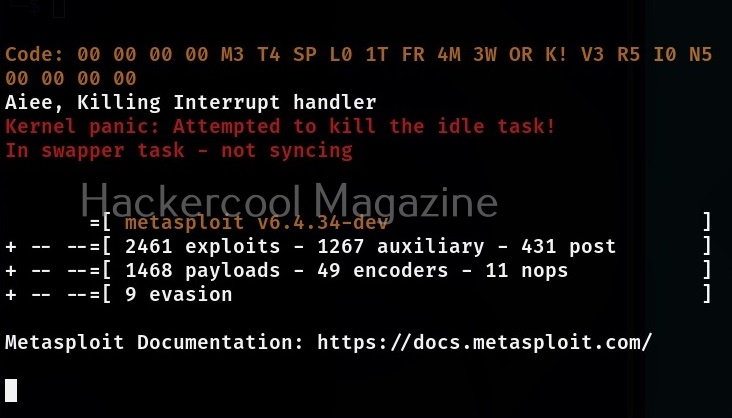
Auxiliary modules in Metasploit perform simple functions like scanning, enumeration, gathering information, logging in into services etc. They have single function. At the time of writing this article, there are over 1267 auxiliary modules in Metasploit.

2. Exploit modules:

Exploit modules are exploit codes written in Ruby. They exploit the vulnerabilities to execute arbitrary code on the target system. At the time of writing this article, there are over 2461 exploit modules in Metasploit.

3. Payload modules:

The arbitrary code that is executed by the exploit modules of Metasploit is known as payload. At the time of writing this article, there are over 1468 payload modules in Metasploit.

4. Encoder modules:

As the name of the module suggests, Encoder modules of Metasploit take raw bytes of a payload as input and run some sort of a encoding algorithm like XOR, Bitwise XOR on the payload code. At the time of writing this article, there are over 49 encoder modules in Metasploit.

5. Evasion modules:

Evasion modules are used to generate payloads that evade Antivirus. At the time of writing this article, there are over 9 evasion modules in Metasploit.
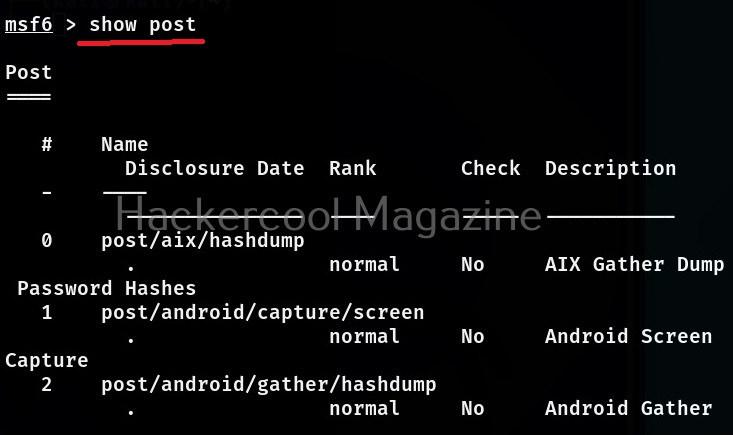
6. POST modules:

POST modules are those modules of Metasploit that are useful during POST exploitation phase of the pen test. At the time of writing this article, there are 431 POST modules in Metasploit.

How to use Metasploit Framework?

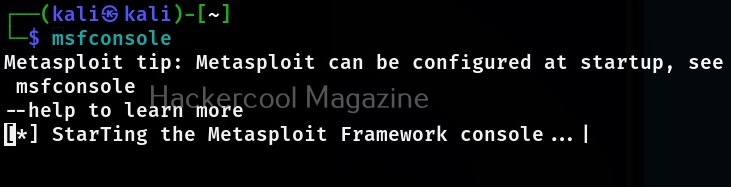
Let’s see how to use Metasploit for beginners. We will be using Metasploit in Kali Linux as it is already installed. To start Metasploit, open a terminal and type command shown below.

msfconsole

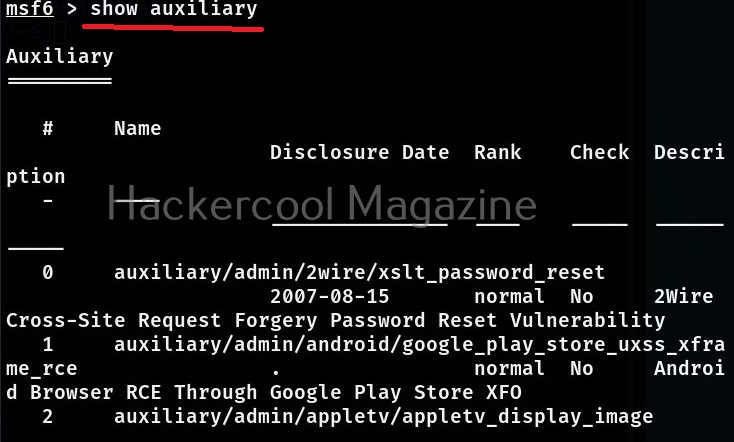
To see all the auxiliary modules of Metasploit, use the command shown below.

show auxiliary

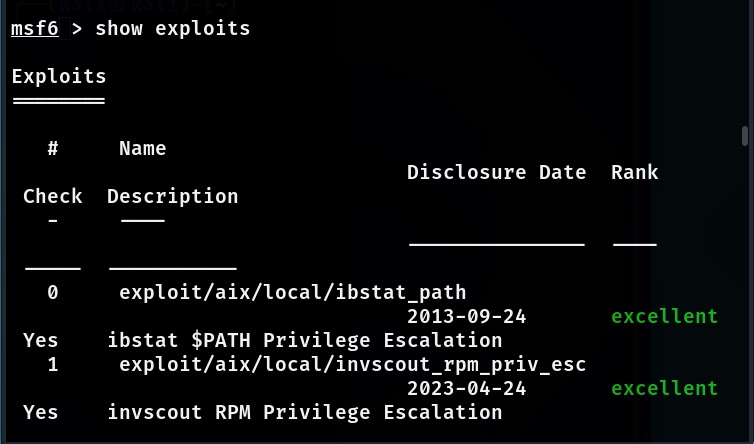
Similarly all the exploits in Metasploit can be seen using the command shown below,

show exploits

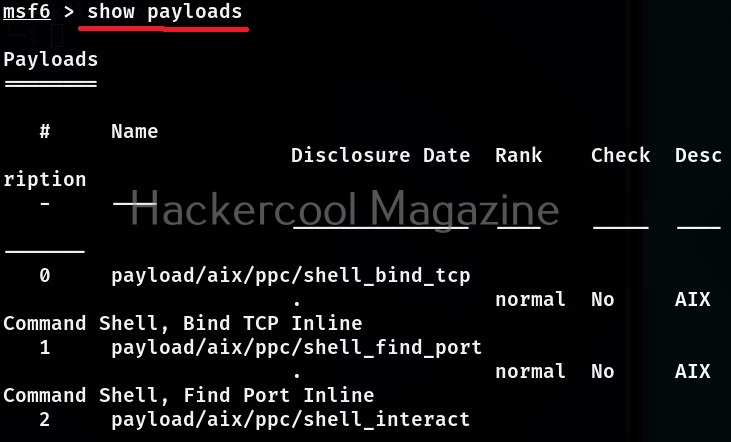
To view all the payloads in Metasploit, you can use the “show payloads” command.

show payloads

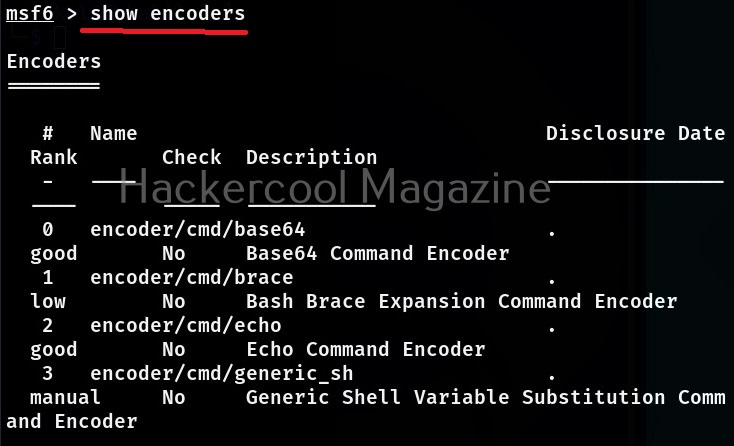
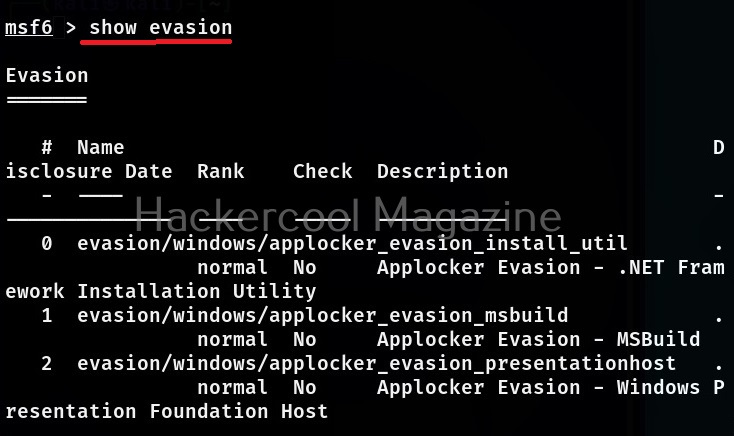
The same commands can be used to view all the encoder, evasion and POST modules of Metasploit respectively.

Now, let’s come to the realistic use of Metasploit. As I already told you at the beginning of this blogpost that the use of Metasploit comes after the stage of footprinting and scanning. As part of vulnerability scanning, we happen to find that one of the devices in the target network is vulnerable to Bluekeep vulnerability.

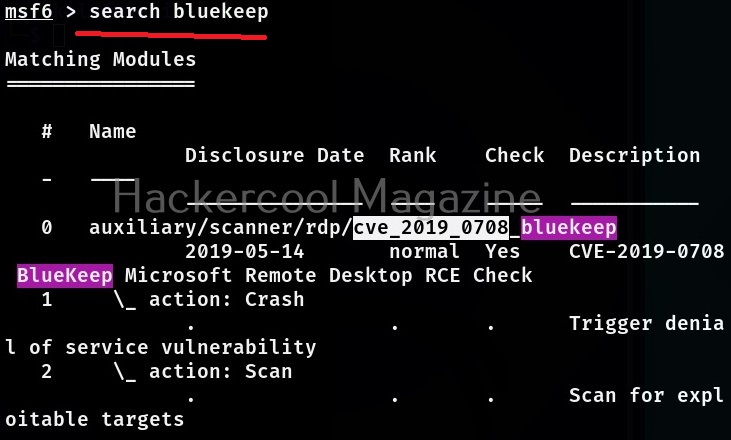
Now, let’s see how to exploit this vulnerability with Metasploit. The first to do after starting Metasploit is to use the search function of Metasploit to search for the exploit we need. For example, “bluekeep” as shown below.

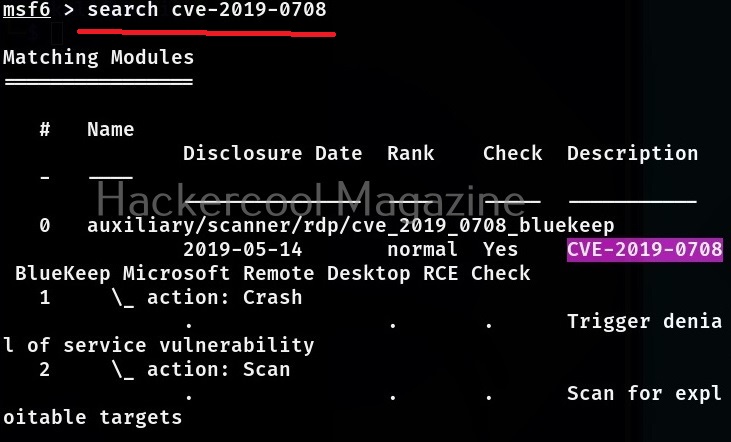
Metasploit has a very versatile search function. You can also search using the CVE ID of vulnerability as shown below.

No matter how you search, Metasploit will show all the modules related to particular vulnerability you searched for. Since, I already know the target machine is vulnerable to Bluekeep vulnerability, I select the exploit module for this vulnerability. To load this module, we can use (literally) and load the module using the entire name of the module or its serial number given at the begining.

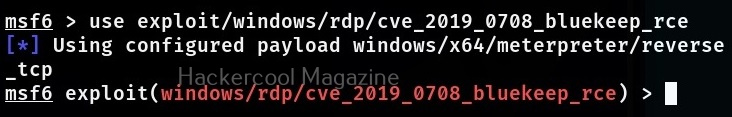
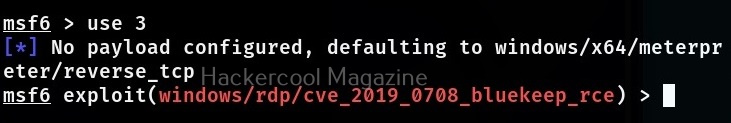
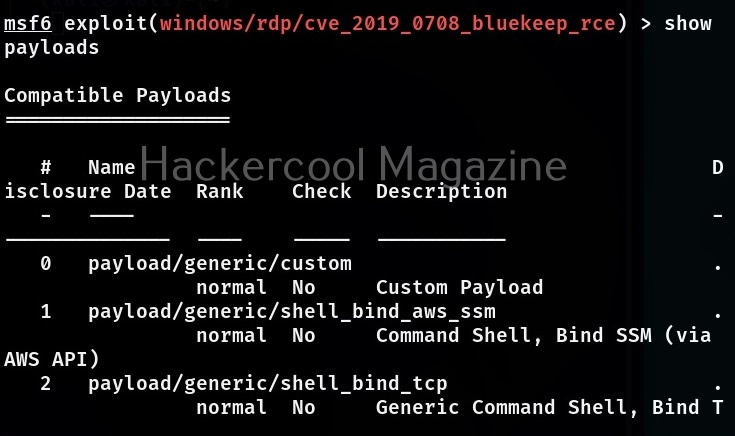
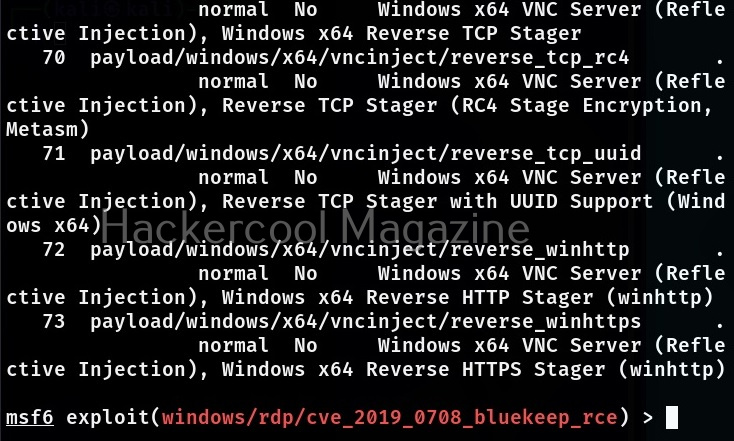
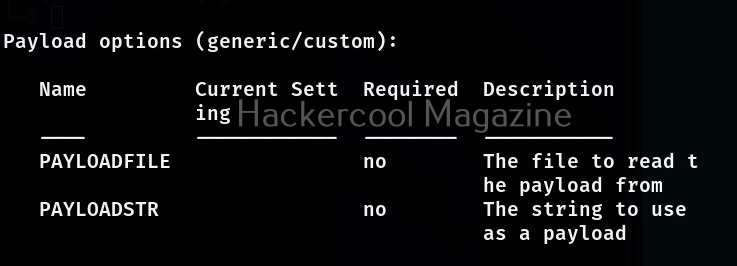
A payload most probably METERPRETER payload is assigned by default as soon as you load the exploit module. If you want to set a different payload other than the default one, you can use “show payloads” command to see all the payloads supported by the selected module. Unlike earlier this will not show all the payloads of Metasploit but only the ones supported by this exploit module.

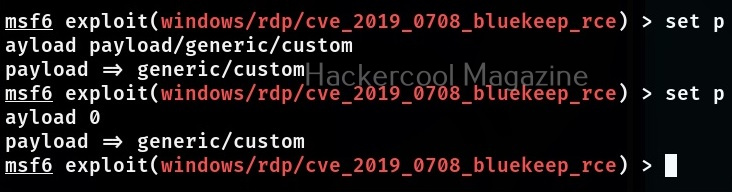
To assign a new payload, we use the “set” command in the same way as we used the “USE” command earlier.

Then we use the “show options” command to see all the options required for this module to work after selecting the payload. The required options are marked with “yes” in the required column.

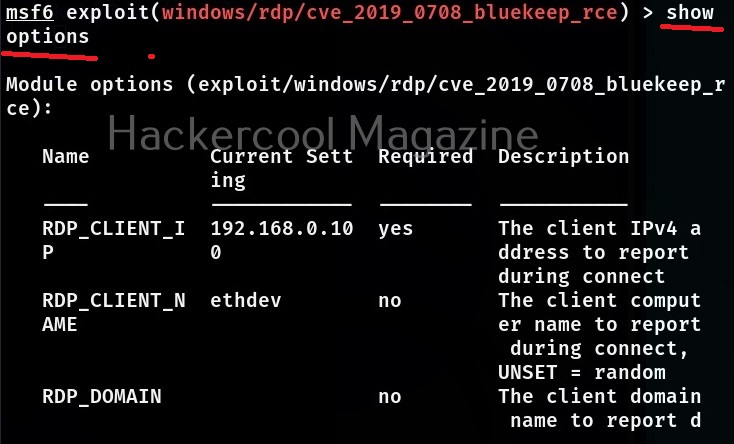
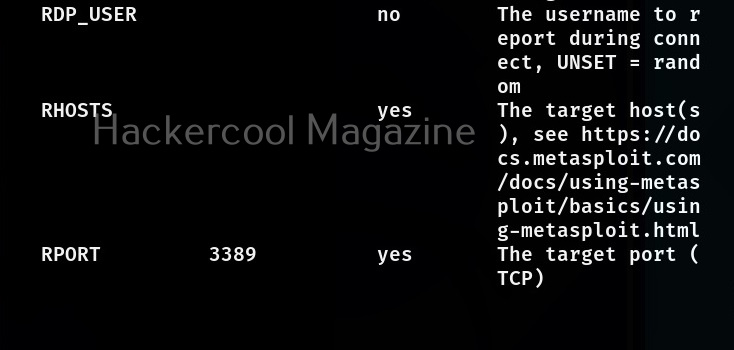
This module required the RHOSTS option which is the IP address of the target system. All the required options can be set with the SET command as shown below.

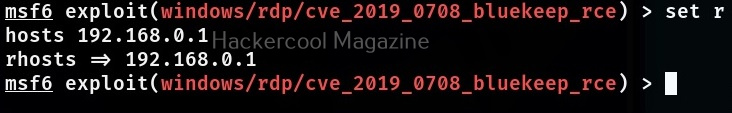
After all the required options are set, all we need to do is execute the module using “run” command or “execute” command. You can see Metasploit module in action in our blogpost on exploiting ms08_067 vulnerability.

Learn how to exploit cve-2018-17456 vulnerability with Metasploit.

Learn how to upgrade a normal command shell to meterpreter session.

Learn how to perform Windows POST exploitation with Metasploit.

If your meterpreter session is not the same as the OS architecture, you can spawn a new process with the correct architecture and migrate to that process using the archmigrate module.

Learn how to perform HTA attack with Metasploit.

Posted on

Beginners guide to Ettercap

Hello, aspiring ethical hackers. In our previous blogposts, you learnt what is sniffing and what is Man in the Middle (MITM) attacks etc. In this blogpost, you will learn about a tool named Ettercap. Ettercap is an open-source sniffer and a comprehensive suite for performing man in the middle attacks. With Ettercap we can perform both active and passive protocol analysis, data injection etc.

Let’s see how to use Ettercap for sniffing. For this tutorial, I will be using Kali Linux as my attacker system as ettercap is installed by default on it. As a target system, I am using Metasploitable 2 (see how to create a virtual hacking lab). Ettercap can be started in both command line and GUI. For this tutorial, let’s use the graphical version.

To start ettercap in graphical mode, start ettercap with the “-G” option as shown below.

sudo ettercap -G

The GUI version of Ettercap opens as shown below.

You can also open a network capture file (pcap file) using Ettercap. To start sniffing with ettercap, we have to click on the highlighted part as shown below after selecting the interface we want to sniff on.

As soon as you do this, Ettercap loads all its plugins and engines required for sniffing. By default, ettercap starts sniffing automatically. It can be stopped or started by clicking on the highlighted part as shown below.

Before you perform any attack, you need to know about all the devices on the LAN. Clicking on the tab highlighted in the image below makes this tool scan for all the LIVE hosts on the network.

After the scan is finished, ettercap adds the detected hosts.

The added hosts can be viewed by clicking of the tab highlighted below.

In our case five hosts have been added. I want to sniff the communication taking place between two machines. To do this, I right click on the IP of the client machine with IP 192.168.249.162 and add it as Target 2.

Similarly, I add the server machine with IP 192.168.249.149 as Target 1.

Needless to say, these two machines are the machines I want to perform sniffing on.

Then, I open the MiTM menu of this tool and select ARP poisoning as shown below.

This opens a new window as shown below.

I select “sniff remote connections” option and click on “OK”. This starts the ARP poisoning attack and all the traffic intending to go for 192.168.249.162 (client machine) to192.168.249.149 (server machine) will be sniffed. From the client machine, I make a telnet connection to target system.

Then on ettercap, I open the menu and go to view > connections.

This will show all the connections being made between client and the server.

In the above image, we can see one connection from IP 192.168.244.162 to port 23 of 192.168.249.149. Clicking on it will reveal the connection data exchanged between the two machines.

By default, the data from the client and server machines are shown in different tabs. You can see the credentials being exchanged between client and server. You can even join both the views for clarity.

Here, you can see the clear text credentials used to login into the telnet server.

Posted on

Beginners guide to tcpdump

Hello, aspiring ethical hackers. In our previous blogpost, you learnt in detail about packet sniffing and packet analyzing. A sniffer or a packet analyzer plays a very important role in packet sniffing. In this blogpost, you will learn about a sniffer or packet analyzing tool called tcpdump.

tcpdump is an open-source data-network packet analyzer that runs under a command line interface. It works on almost all Unix-type operating systems like Linux, Solaris, FreeBSD, macOS etc. Tcpdump was written by Van Jacobson, Sally Floyd, Van Paxson and Steven McCanne in 1998 while working in Lawrence Berkely Laboratory Network Research group. Let’s see how to perform packet sniffing with tcpdump. For this tutorial, we will be using Kali Linux as tcpdump is installed by default on it.

The command to start sniffing with tcpdump is given below.

tcpdump

if you are unable to start tcpdump with the above command, run tcpdump as sudo. On many UNIX operating systems, running this command requires SUDO privileges.

sudo tcpdump

As soon as you execute the above command, tcpdump starts sniffing on all the network interfaces connected to the machine. If you want tcpdump to perform sniffing on only a specific interface, you can specify the interface with the ‘-i’ option.

sudo tcpdump -i <network interface>

Depending on the number of devices connected to the interface, the packet analysis output may contain heavy or less traffic. To view traffic belonging to only one machine on the network, you can use the “host” option and specify the IP address. For example, let’s say we want to only see traffic belonging to device with IP 192.160.254.144 on the network. Here’s how to do it.

sudo tcpdump -i <network interface> host <host ip>

Let’s say you want to view traffic only that is originating from a particular device, you can use the option “src” for that.

sudo tcpdump -i <network interface> src <device IP>

Similarly you can also view only the traffic that is coming to the particular system using the “dst” option.

sudo tcpdump -i <network interface> dst <device IP>

We can also view traffic belonging to a specific part using the “port” option.

sudo tcpdump -i <network interface> port <port number>

To write the output to a file, we have to use the “-w” option as shown below.

sudo tcpdump -i <network interface> port <port number> -w <file to write to> 

To open the saved pcap file, you have to use the ‘-r’ option as shown below.

sudo tcpdump -r <pcap file>

This pcap file can also be opened with Wireshark.

Posted on

WhatWeb tool: Beginners guide

Hello, aspiring ethical hackers. In one of our previous blogpost, you learnt about what is website hacking, what are the various website hacking techniques used by hackers etc. In this blogpost, you will learn about WhatWeb tool, a web scanner.

WhatWeb tool is a tool that can be used to identify a website. As its makers say, the goal of WhatWeb tool is to answer the question “What is that website?”.

That’s right because WhatWeb can identify a variety of web technologies used on a website that include web servers, Content Management System (CMS), blogging platforms, statistics and analytic packages, JavaScript libraries, embedded devices, version numbers of the software, email addresses, account in web framework modules, SQL errors etc. WhatWeb too has over 1800 plugins, each to recognize something different.

WhatWeb is installed by default in Kali Linux. Let’s see how to use it for scanning the website. As target, we will be using Multillidae in Metasploitable 2. To scan a website, all you have to do is specify the target website or its IP to WhatWeb as shown below.

WhatWeb has different levels of aggression while scanning its targets. By default it is set to 1 (stealthy) and it makes one HTTP request per target. However, we can set the level of aggression while scanning the target. If we set the aggression level to “3 (aggressive)” as shown below, WhatWeb will send additional requests once it finds a level 1 plugin.

Similarly, setting the aggression level to “4 (Heavy)”, WhatWeb makes a lot of HTTP requests per target. In this level, URLs from all plugins are attempted.

At the beginning of the article, I told you that WhatWeb has lot of plugins each suited for a specific purpose. You can view all the plugins of WhatWeb using the “-l” option.

If you want to view the information about each plugin the “–info-plugins” option will do this for you.

You can also search for a particular plugin from the list of plugins using the “–search- plugins” option. For example, let’s search for webdav plugin in WhatWeb.

To use a particular plugin the option is “-p”. For example, let’s use the “webdav” plugin with the same target.

If you want the result to be in more detailed format while scanning with WhatWeb, you can use the verbose option with WhatWeb.

Whatweb also has a quiet mode scan option that scans a website without showing output to terminal (stdout) as shown below.

Posted on

Beginners guide to dirbuster

Hello, aspiring ethical hackers. In this blogpost, you will learn about dirbuster, a tool used to scan web directories and file names on web application servers. Dirbuster is written in Java and can be installed on Linux systems. Almost all pentesting distros include this in their tools list. For this tutorial, we are going to use Kali Linux. Dirbuster can be started on Kali by using the command as shown below.

dirbuster

Typing this command will open a GUI window as shown below.

Here, you can configure all the options required to scan the target web server. For this tutorial, we will be using Metasploitable 2 as our target. Any directory scanning and fuzzing tool is as good as the wordlist it uses while scanning for hidden directories and files. Dirbuster provides its own set of wordlists which are located in “usr/share/dirbuster/wordlists” directory in Kali.

Unlike other wordlists, these wordlists are created using a different approach. These lists are created from scratch by crawling the internet and making a collection of the all the files used by all developers. It comes with a total of 9 different lists. If all these lists fail, dirbuster also has brute force option.

The scan starts. Depending on the size of the target web server, finishing time may vary. The progress of the scan will be displayed in the “scan information” tab.

As the scan continues, you can see the results in different views. The “List view” shows all the detected directories and files by dirbuster in the form of a list.

You can also see the results of the scan in the form of “Tree view” that enables us to gain understanding about the target web server directories structure.

You can right click on the detected directories for more options as shown below.

If dirbuster faces any errors while scanning directories, they are displayed in the “errors” tab.

You can wait until the scan finishes or you can even end the scan by hitting “stop” button. Once you do that, dirbuster will prompt you to save the result of the scan as shown below.

You can also use dirbuster by specifying its options through command line. The basic options to set are the URL and the wordlist. These can be set with ‘-U’ and ‘-r’ options respectively.

Then, all you have to do is click on “Start”. If you want to find files with a particular extension with dirbuster the option is ‘-e’. For example, let’s say you want it scan for files with “php” extension here is the command,

To save the output of dirbuster scan, use command line option ‘-r’.

Headless mode (-H)

You can run dirbuster in headless mode without GUI option as shown below.