Hello, aspiring ethical hackers. In our previous blogpost, you learnt about Blue Teaming. In this article, you will learn about Splunk, a platform that plays a vital role in Blue Teaming. When you start learning cybersecurity, one of the first things you hear is: “Check the logs.” But what logs? Where are they stored? And how do you make sense of millions of events generated every day? This is where this platform comes in.
New to Ethical Hacking?
Start your journey with The Beginner Ethical Hacker Starter Kit (2026 Edition).
Inside the free guide, you’ll learn:.
- Ethical hacking fundamentals
- Beginner cybersecurity roadmap
- Essential hacking tools
- Common vulnerabilities explained
Splunk is a powerful platform that helps organizations collect, search, analyze and visualize machine data. For beginners, it serves as an excellent introduction to how real security teams monitor systems, investigate incidents and find suspicious activity.
What Is Splunk?
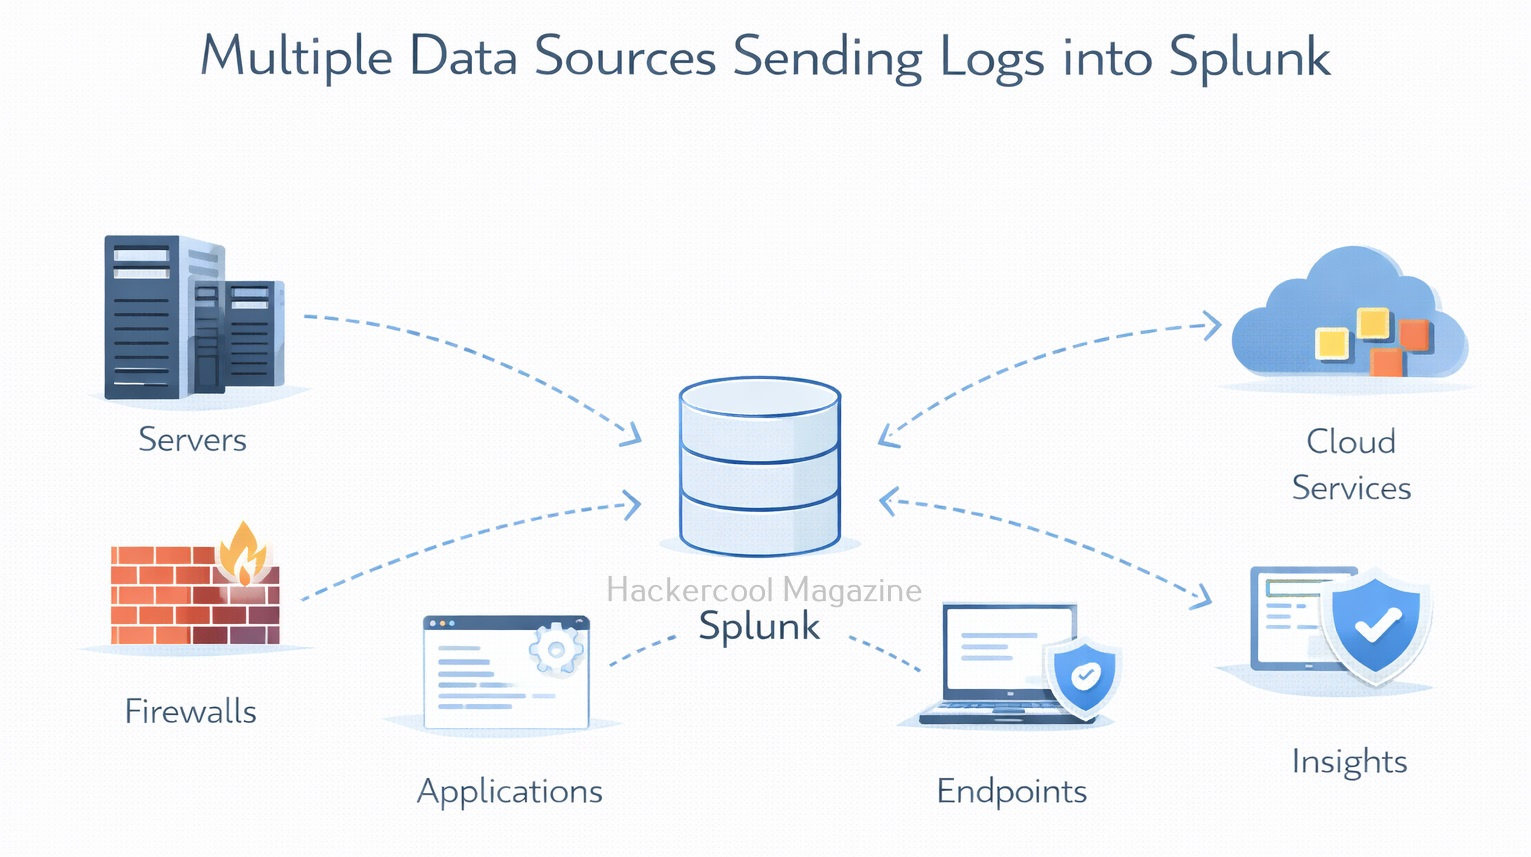
Splunk is a data analytics platform that specializes in machine-generated data, such as logs from servers, applications, firewalls, endpoints and cloud services. It is widely used by Security Operations Centers (SOCs), IT teams and incident responders.
It is commonly used for:
- Log management
- Security monitoring
- Incident investigation
- Operational troubleshooting
In simple terms, Splunk helps answer the question:
“What is happening across my systems right now and what happened in the past?”
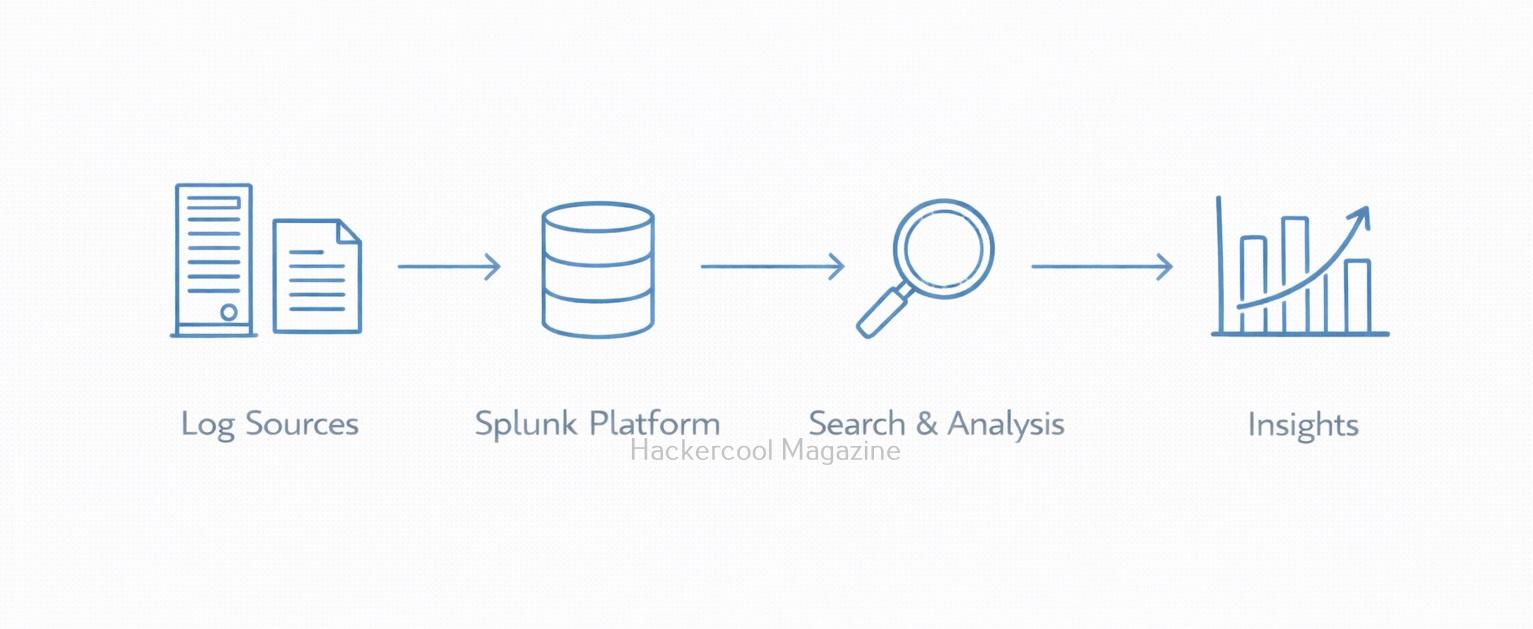
How Splunk Works?
At a high level, it works in three main steps. They are,
1. Data Ingestion:
Splunk collects data from many sources, such as:
- Operating system logs
- Application logs
- Network devices
- Cloud services
This data is indexed so it can be searched quickly.
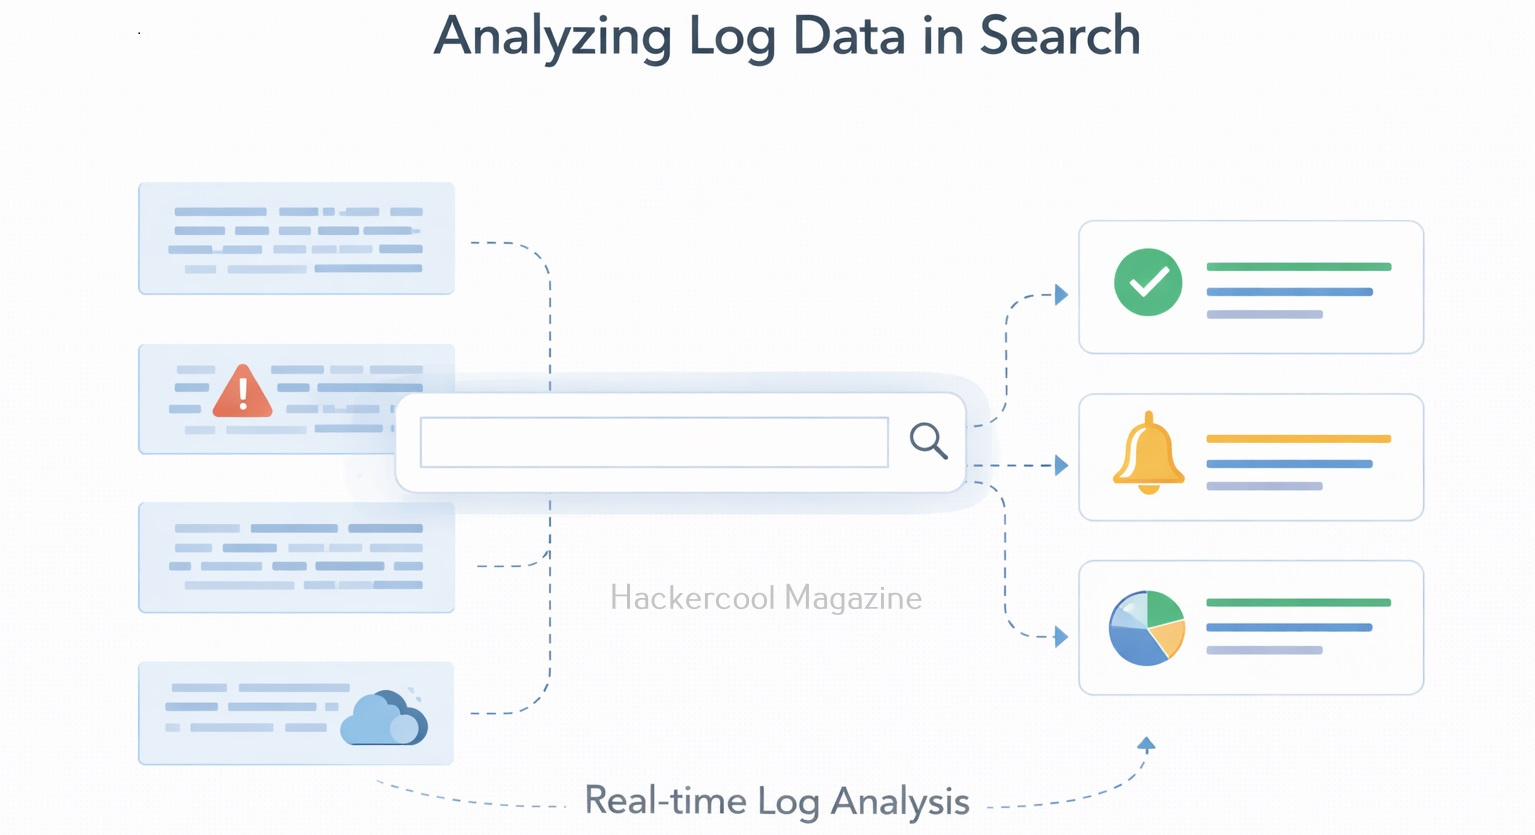
2. Searching and Analysis:
Once data is indexed, users can search it using the Splunk Search Processing Language (SPL). Beginners don’t need to master SPL immediately. Basic searches are often enough to get started.
Want to Learn Ethical Hacking Step-by-Step?
If you’re serious about learning cybersecurity, a structured roadmap makes the journey much easier.
Download The Beginner Ethical Hacker Starter Kit (2026 Edition) and discover:
✔ The ethical hacking learning path
✔ Beginner-friendly security concepts
✔ Essential tools ethical hackers use
✔ The most common vulnerabilities explained
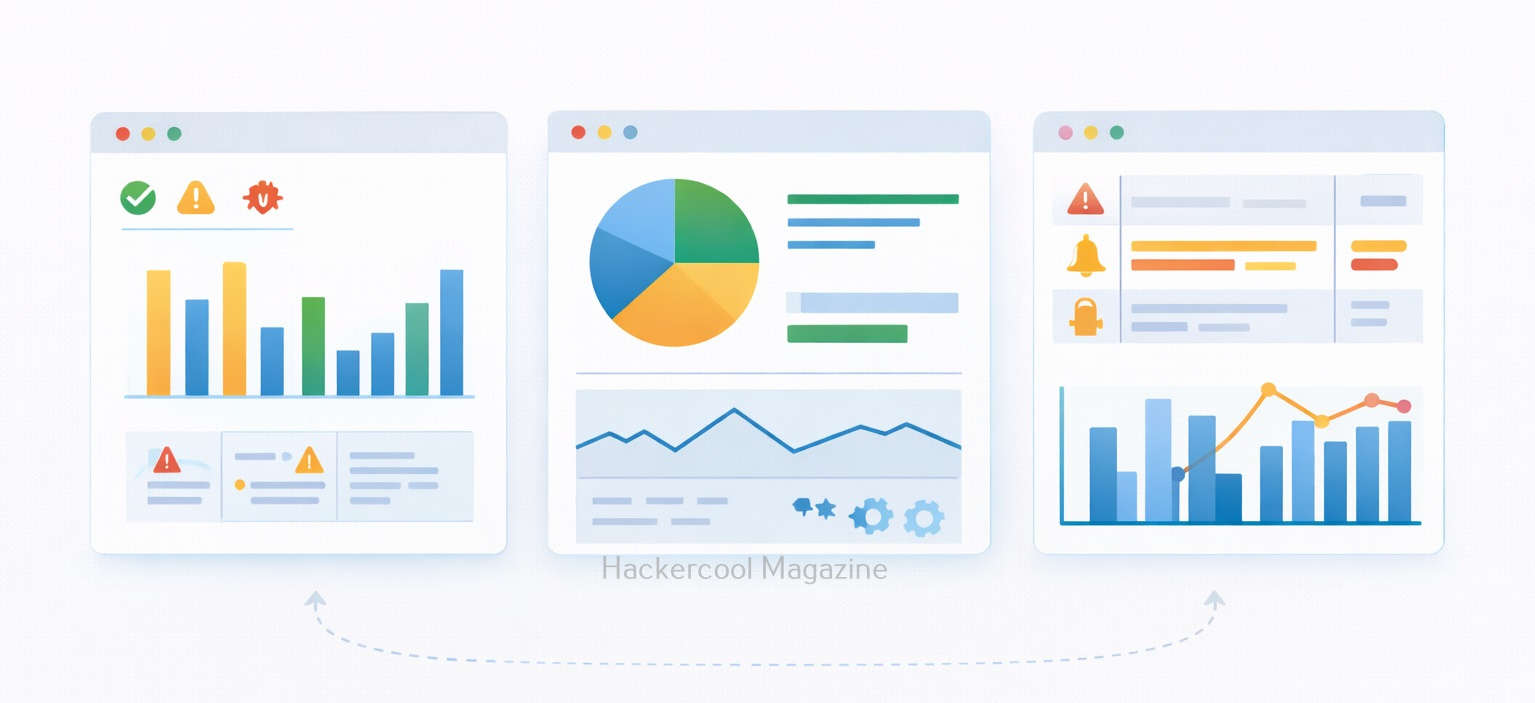
3. Visualization and Alerts:
It also allows users to create:
- Dashboards
- Charts and graphs
- Alerts based on conditions
These features help teams spot issues quickly and track trends over time.
Common Security Use Cases of Splunk
It is widely used in cybersecurity for tasks such as:
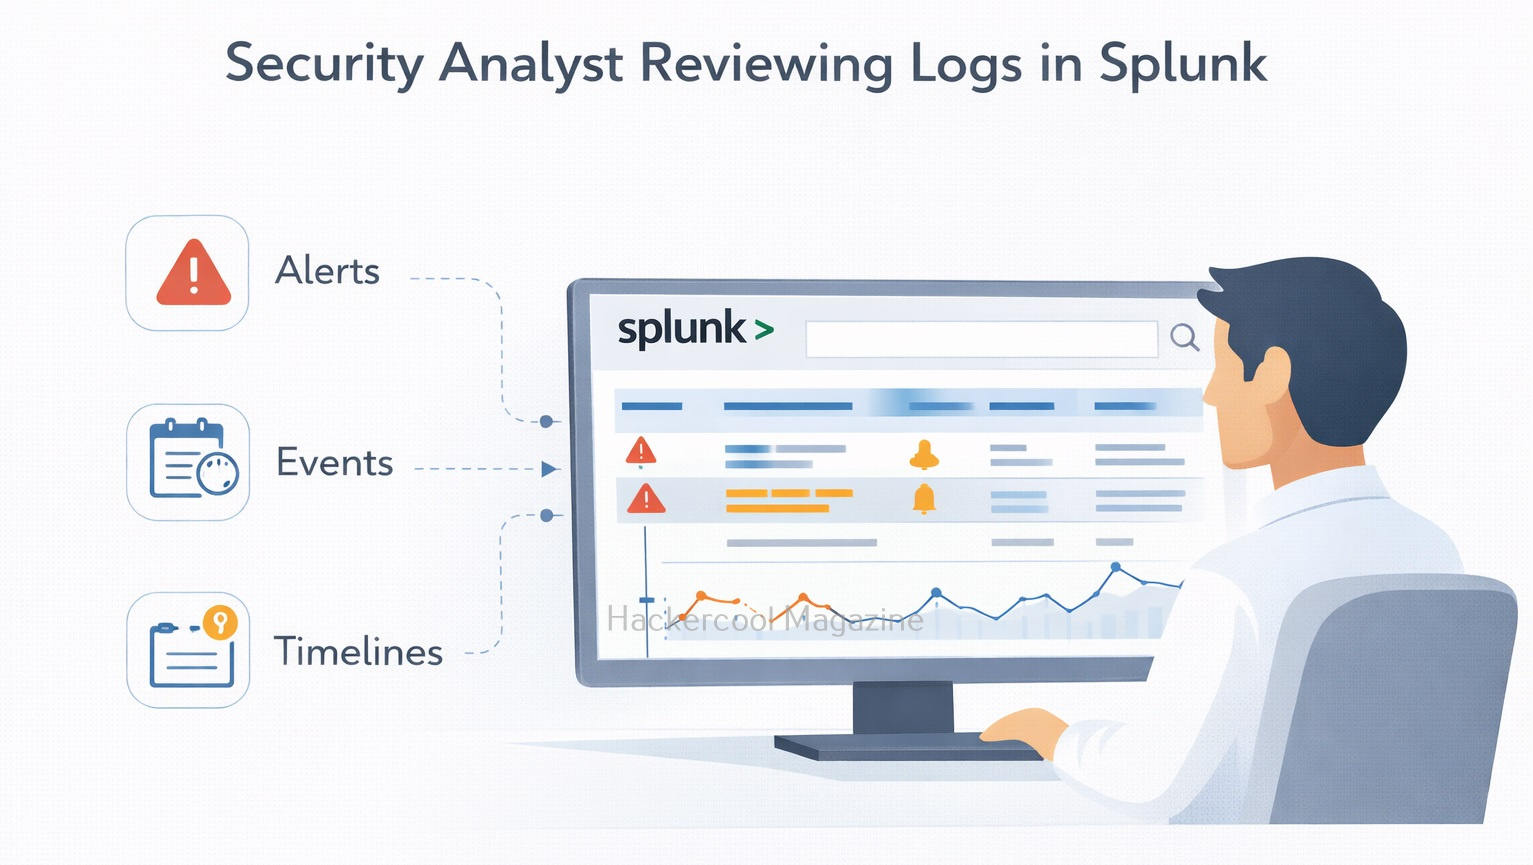
- Log analysis – Reviewing authentication attempts, errors and access logs
- Threat detection – Identifying suspicious behavior or anomalies
- Incident investigation – Reconstructing timelines during security incidents
- Compliance monitoring – Tracking access and configuration changes
- SOC dashboards – Providing real-time visibility into security events
Many SOC analysts spend a large part of their day inside Splunk.
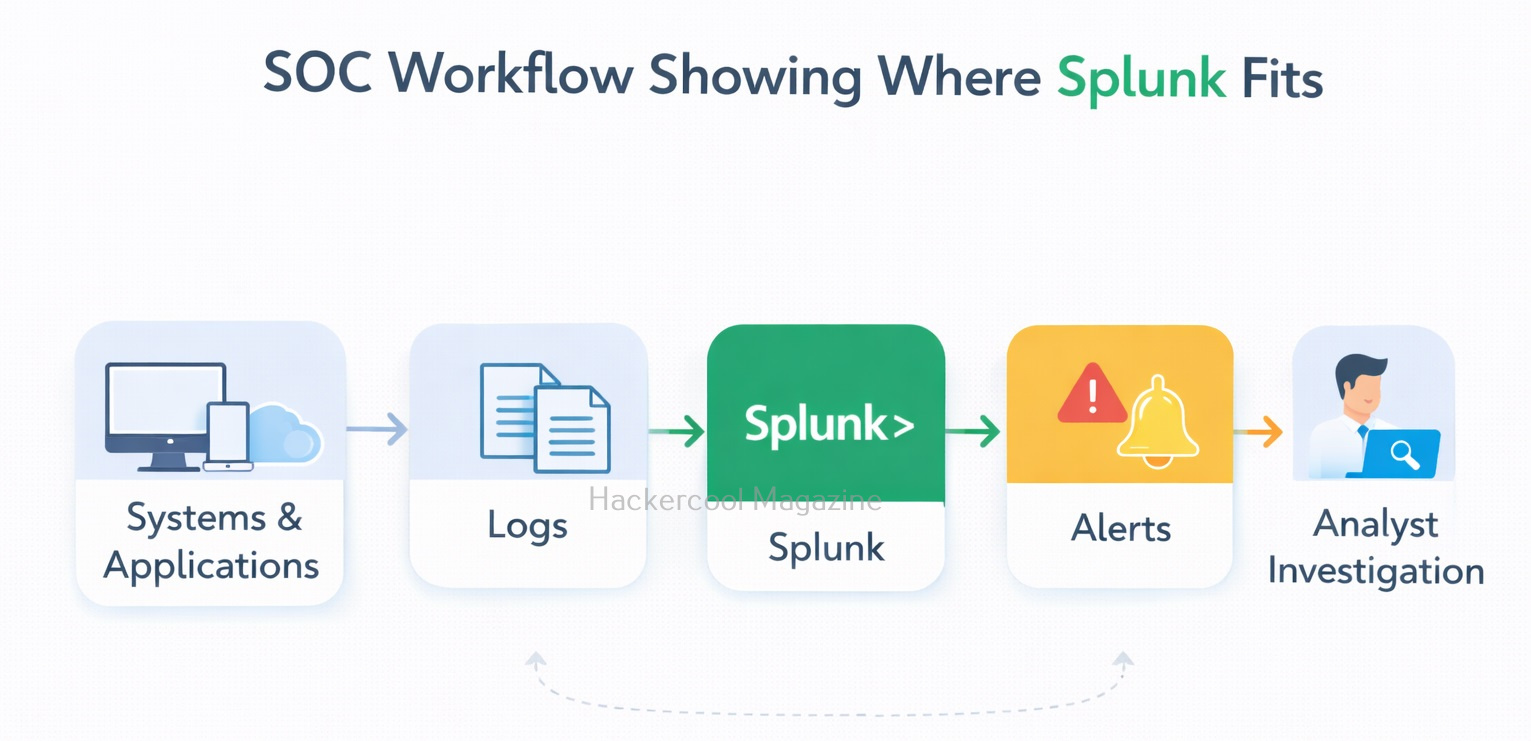
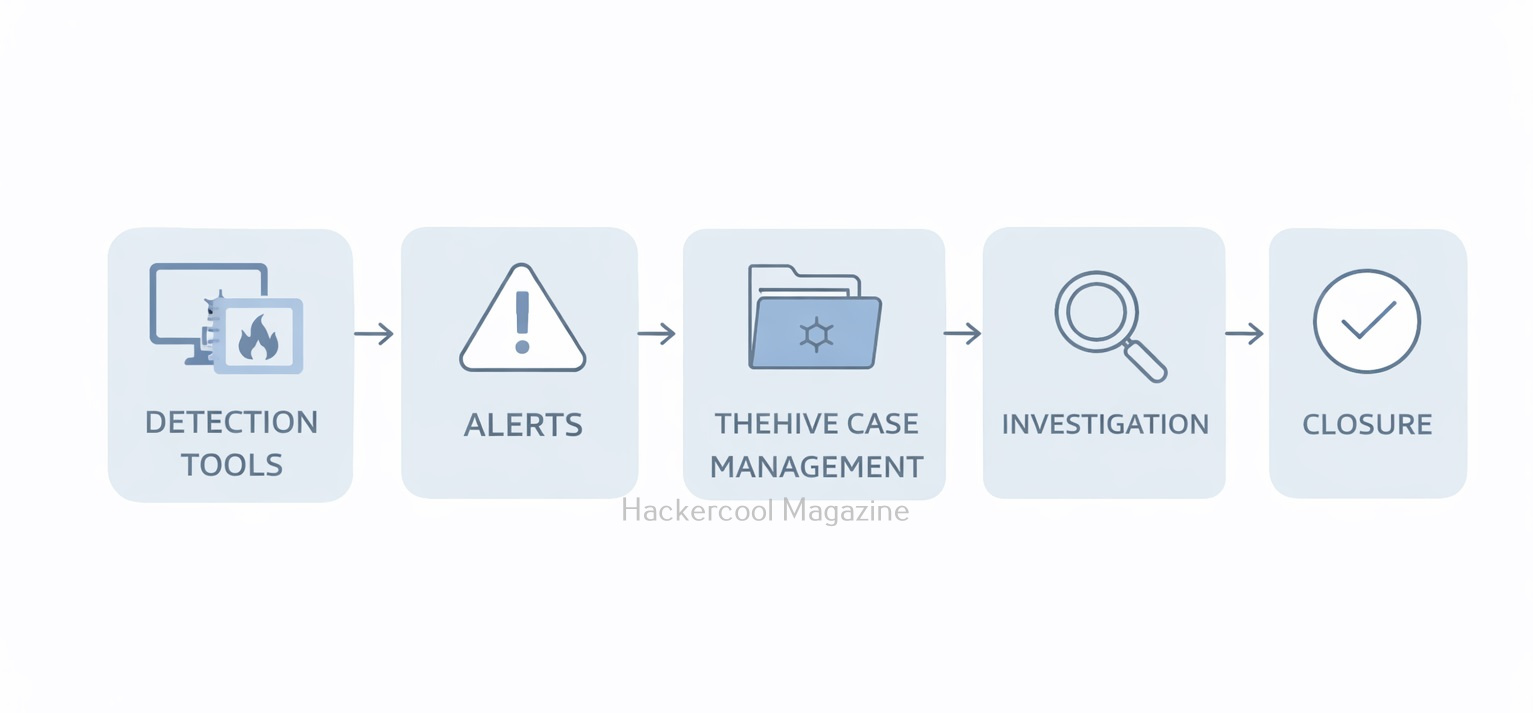
Splunk in a SOC Workflow
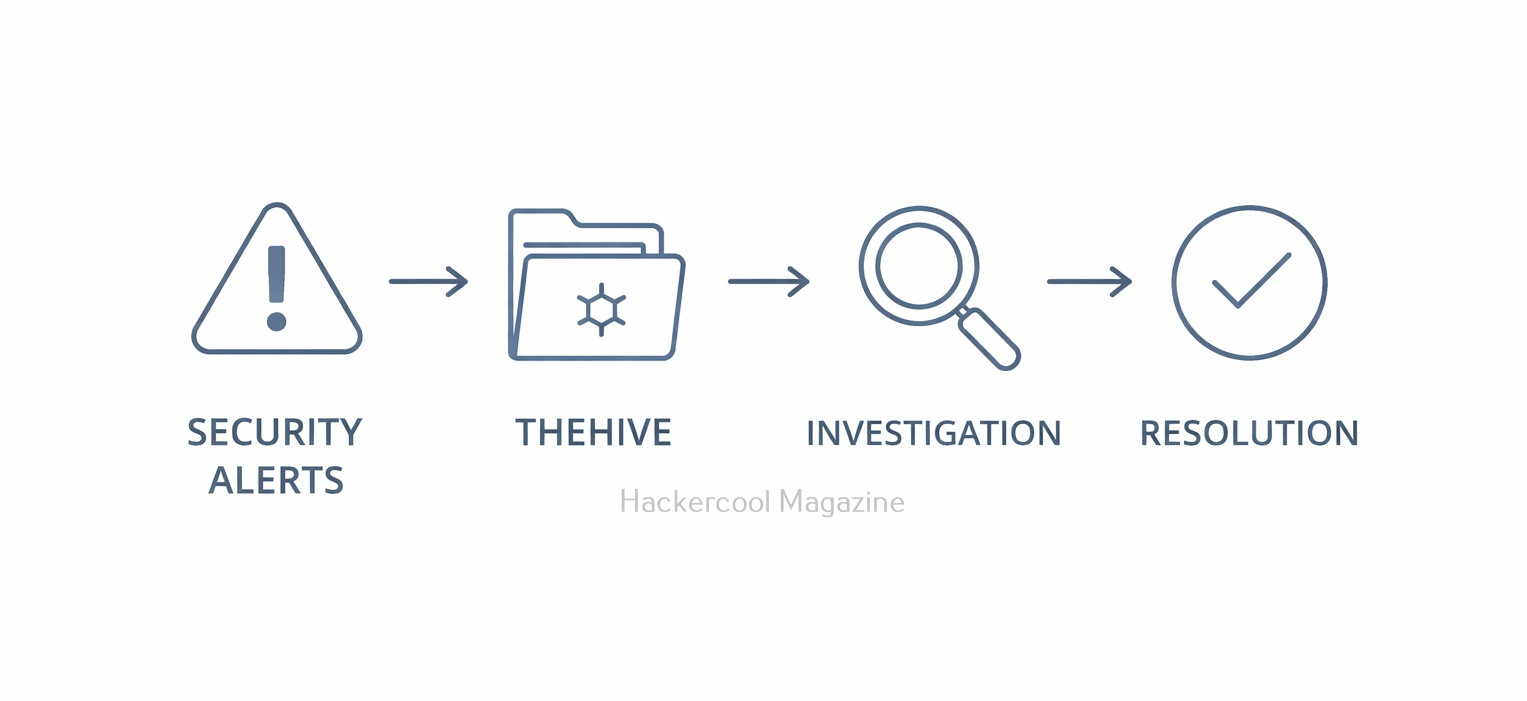
This platform is usually part of a larger security ecosystem. A simplified SOC workflow looks like this:
- Systems and applications generate logs
- Logs are sent to Splunk
- Alerts are created based on suspicious patterns
- Analysts investigate events in Splunk
- Findings are escalated or documented
It helps connect alerts to actual evidence, instead of treating them as isolated warnings.
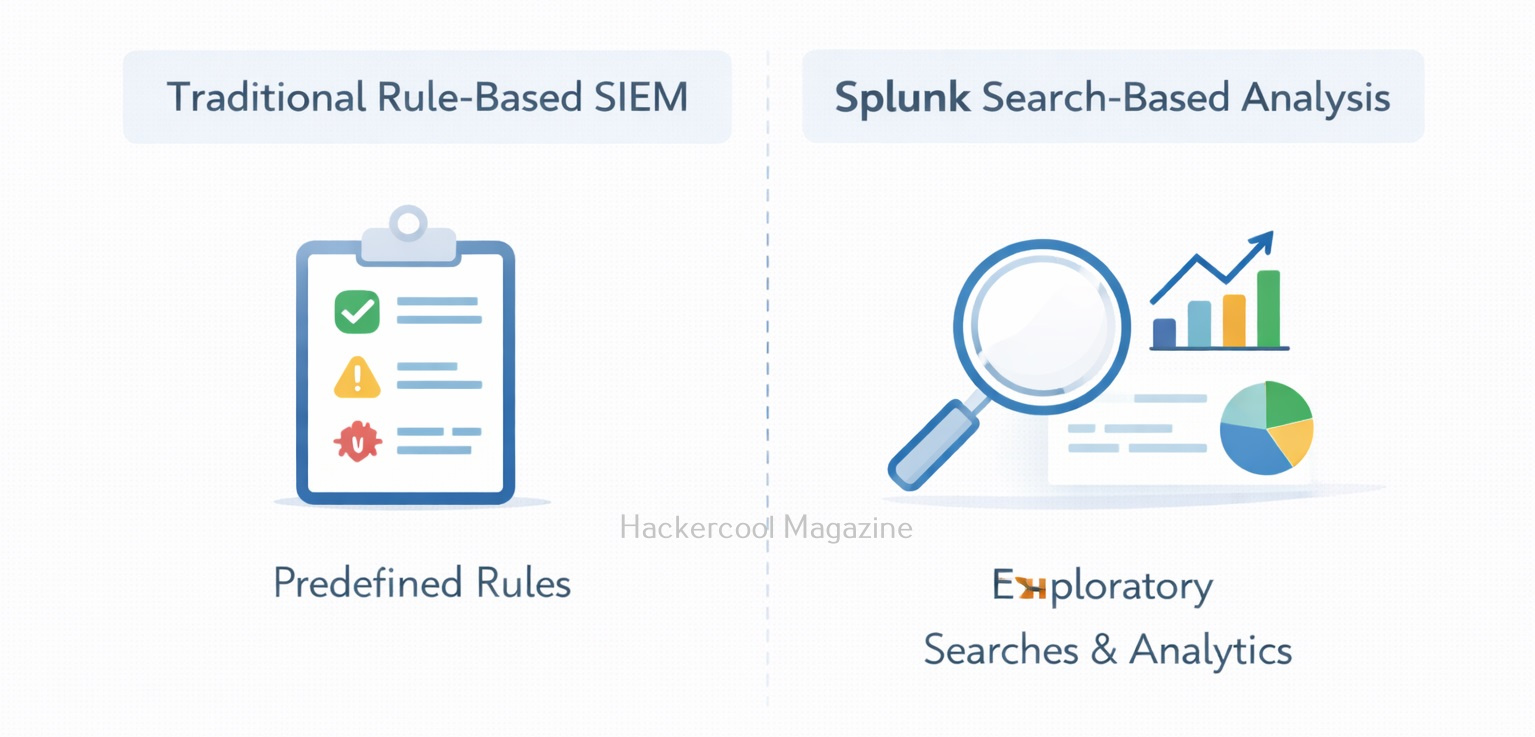
Splunk Vs SIEM
Beginners often hear Splunk described as a SIEM (Security Information and Event Management) tool. While it can really act as a SIEM, its core strength is data analysis.
- Traditional SIEMs often focus on predefined security rules
- Splunk focuses on flexible searching and analysis
Why Splunk Matters for Beginners?
Beginners often focus on individual tools or attacks, but real-world security work is about visibility and context. Splunk teaches beginners how to:
- Work with large volumes of log data
- Identify patterns and anomalies
- Investigate alerts using evidence
- Think like a SOC analyst
Learning this early helps bridge the gap between theory and real operational security. Moreover, Splunk skills are in high demand across:
- Cloud security teams
- SOC teams
- Incident response roles
- Blue team operations
Even basic knowledge of this helps beginners understand how organizations monitor and investigate their environments. The skills you learn: log analysis, correlation and investigation transfer easily to other tools.
What Beginners Should Focus On First?
Splunk can feel overwhelming at first. To make learning simple, beginners should focus on a few fundamentals:
- Understanding what logs are and why they matter
- Learning basic search queries
- Reading timestamps and event fields
- Building simple dashboards
- Following investigation workflows
You do not need to learn advanced SPL or automation on day one.
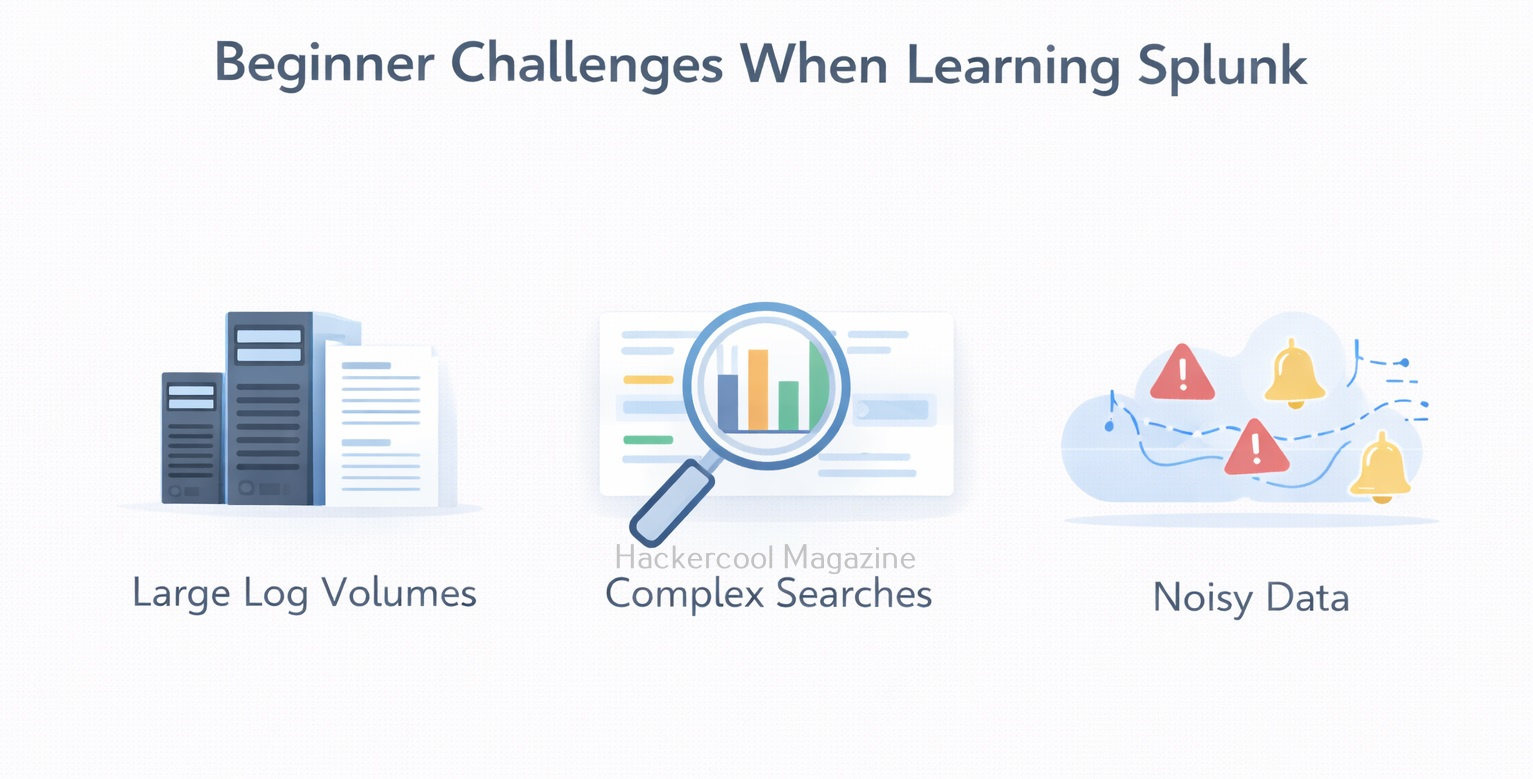
Challenges Beginners May Face
It’s normal to face some challenges when learning Splunk, such as:
- Large volumes of data
- Complex search syntax
- Too many dashboards and features
- Difficulty knowing what is “normal” behavior
These challenges improve with practice and exposure. Labs and sample datasets are especially helpful for beginners.
Conclusion
Splunk is not just a tool. It’s a way of thinking about data and security. For beginners, it provides a practical window into how real-world security teams detect problems, investigate incidents and make decisions based on evidence.
By learning this early, beginners gain confidence working with logs, understanding alerts and seeing the bigger picture of cybersecurity operations. As you progress, this tool becomes not just a platform you use, but a skill that supports almost every area of modern security work.
Start Your Ethical Hacking Journey Today
Learning cybersecurity can feel overwhelming at first. The best way to start is with a clear roadmap and the right resources.
Download The Beginner Ethical Hacker Starter Kit (2026 Edition) and get instant access to:
✔ Ethical hacking fundamentals
✔ A beginner cybersecurity learning roadmap
✔ Essential hacking tools every beginner should know
✔ Common vulnerabilities explained simply